Table of Contents
Walk along any healthy creek and watch how water moves. It never travels in straight lines or rigid boxes. Instead, water bends around mossy boulders, slows down in deep pools, and rushes over gravel riffles. Every drop connects upland forests to valley farms, neighborhood parks, and downstream rivers.
Now compare that living system to the average conservation nonprofit website. Most watershed groups rely on stiff, boxy templates built from sharp rectangles and stacked columns. That clash between living nature and rigid web design creates an immediate problem for organizations trying to protect local waterways.
Watershed associations do vital, complex work every single day. Your teams plant native trees along eroding banks, remove outdated dams, track aquatic insects, and test stream water after heavy storms. Yet when community members visit your website, that inspiring work often hides behind dull text blocks and hard-to-find files. When a website feels like a cold filing cabinet, visitors click away before they ever understand why your creeks need their help. This is where storytelling with streams comes in.
There is a much better way to share your mission online. By using biophilic design principles and organic web layouts, you can turn a flat brochure site into a living digital river. Effective storytelling with streams guides visitors naturally from the top of your homepage down to meaningful action. It turns confusing scientific charts into clear local stories that educate neighbors, inspire volunteers, and motivate donors to give.
At Silphium Design, we build biophilic digital ecosystems made specifically for environmental groups, native plant nurseries, and watershed leaders. Our approach blends ecological science with modern web engineering. When your website flows like the waterways you protect, people feel an instant bond with your work. Practicing storytelling with streams bridges the gap between field science and public support, helping your organization grow its impact year after year.
Four Digital Bottlenecks Holding Watershed Associations Back
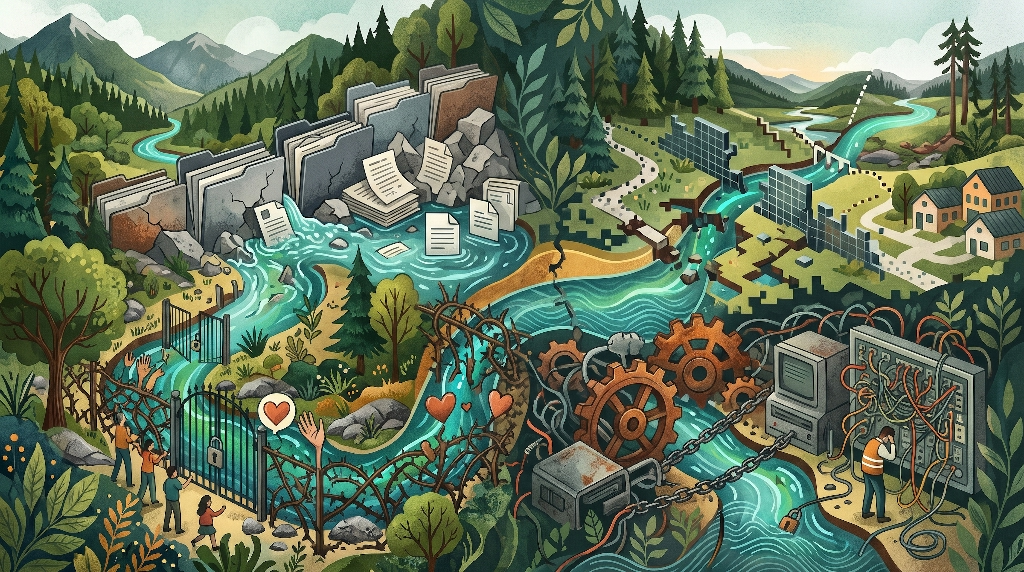
Even the most dedicated riverkeepers and watershed councils struggle with outdated websites. Most small conservation teams spend their limited budgets on boots-on-the-ground restoration, leaving their digital home as an afterthought. Over time, four major bottlenecks quietly drain visitor attention, frustrate staff, and cost your organization vital funding.
The PDF Graveyard Effect
Many watershed groups treat their website like a digital storage locker. Every spring, staff upload a 40-page annual water quality report, dozens of board meeting minutes, and raw spreadsheet tables as downloadable PDF files. While those documents contain valuable science, almost nobody on the public web ever reads them.
Mobile visitors make up more than half of all nonprofit web traffic today. Trying to read a multi-column PDF on a six-inch phone screen requires constant pinching, zooming, and sideways scrolling. Most visitors give up within ten seconds. True storytelling with streams brings your best discoveries out of those hidden files and places them directly onto clean, readable web pages where everyone can enjoy them.
The Upstream-to-Downstream Disconnect
A watershed is a single connected web, yet most websites chop conservation work into isolated buckets. One page lists water testing dates, another page mentions tree plantings, and a third page talks about local flooding. Visitors rarely see how those pieces fit together in their own backyard.
When a homeowner lives five miles uphill from a river, they might not realize that runoff from their street affects trout habitat downstream. Without a visual map or narrative thread linking upstream land care to downstream water quality, residents miss their personal role in the ecosystem. Strong storytelling with streams makes those invisible connections obvious at a single glance.
Donor and Volunteer Friction
Imagine a local resident who loves kayaking on your river and wants to help keep it clean. They land on your homepage, look for a way to pitch in, and immediately hit a wall of confusing menus. The volunteer sign-up form is buried three clicks deep, the event calendar is out of date, and the donation button blends into the corner of the screen.
Generic stock photos make this problem even worse. Using fake, staged pictures of smiling models holding clipboards destroys authenticity. Supporters want to see real neighbors wading into their local creek with dip nets and willow stakes. When your layout creates friction instead of warmth, potential donors close their tabs and take their generosity elsewhere.
Staff Maintenance Burnout
Behind many sluggish nonprofit websites is a clunky, outdated content management system. Maybe a well-meaning volunteer built the site eight years ago using a complicated page builder, and now nobody on staff knows how to update it without breaking the layout.
Posting a simple alert about high bacteria levels after a summer storm or adding a new Saturday cleanup event turns into a stressful ordeal. When staff members fear touching their own website, fresh stories stop appearing. Your digital presence freezes in time while your real-world work moves forward.
The Science of Biophilic Web Design in Conservation
To fix these digital bottlenecks, we need to look at how the human brain responds to natural environments. Biophilic design is the practice of bringing natural patterns, textures, and spatial flow into human-built spaces. While architects have used biophilic principles in buildings for decades, applying them to digital screens is transforming how environmental nonprofits connect with the public.
Defining Biophilic UX
Biophilic user experience, or UX, designs websites around how human minds evolved to read landscapes. In nature, humans feel calm and curious when a view offers both safety and mystery. Scientists call this prospect-refuge theory. On a trail, a gentle curve ahead invites you to keep walking just to see what lies around the bend.
The same psychology applies to storytelling with streams on a webpage. Gentle curves, natural spacing, and layered visual depth signal safety and comfort to the brain. Instead of feeling overwhelmed by walls of text, visitors relax and stay on the page longer. Biophilic design also uses soft, repeating natural shapes, known as fractals, which reduce eye strain and improve focus.
Why Grids Feel Clinical
Standard web design relies heavily on rigid, 90-degree boxes arranged in strict columns. That layout style works fine for online shoe stores or accounting software, where shoppers want fast, mechanical comparisons. However, sharp boxes feel cold and clinical when applied to living ecosystems.
Hard borders chop your mission into disconnected compartments. Each box tells the reader’s eye to stop, evaluate, and move on. Organic layouts do the exact opposite. By softening edges and letting visual elements flow smoothly from one section into the next, storytelling with streams encourages continuous scrolling and deeper emotional memory.
Regional Authenticity
Color plays a massive role in how people judge trustworthiness within seconds of landing on your site. Many environmental groups default to bright, sterile “corporate tech blue” paired with harsh white backgrounds. Those colors feel artificial and strain the eyes.
At Silphium Design, we build color palettes sampled directly from your local watershed ecology. Think of the deep teal of a shaded river pool, the warm gray of wet limestone, the golden amber of tannin-rich forest creeks, and the soft green of riparian moss. When your website mirrors the exact colors of your local landscape, community members immediately recognize it as an authentic reflection of home.
Designing the Digital Stream: Organic Layout Techniques That Guide Action
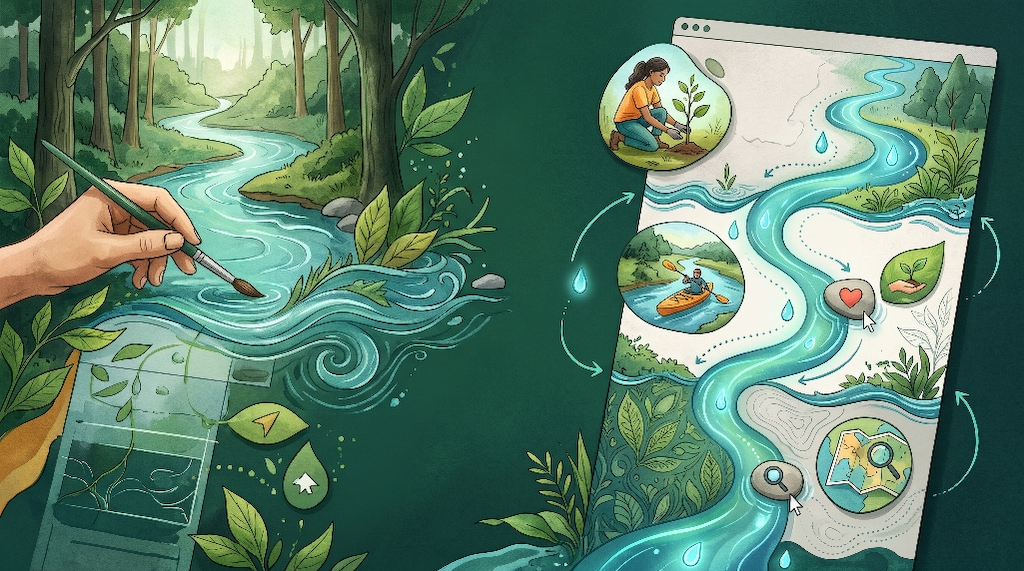
Turning biophilic science into a working website requires smart visual engineering. You do not need flashy cartoons or distracting animations that make visitors dizzy. Instead, thoughtful organic layout techniques use subtle movement and natural geometry to lead readers smoothly toward your goals.
Hydrological Scrollytelling from Headwaters to Confluence
One of the most effective ways to structure a homepage or annual impact report is hydrological scrollytelling. In this layout, scrolling down the screen mirrors the physical journey of water from mountain headwaters down to the main river confluence.
At the top of the page, you introduce the source of your watershed and the core challenges facing your creeks. As the visitor scrolls downward, they travel through your active restoration programs, just like a stream gathering strength from smaller tributaries. By the time they reach the bottom of the page, those combined efforts flow into measurable community outcomes like cleaner drinking water and thriving fisheries. This natural arc makes storytelling with streams intuitive for every reader.
Fluid SVG Wave Dividers and Meander Lines
Hard horizontal lines between website sections act like concrete dams that block visual momentum. Replacing straight borders with fluid Scalable Vector Graphics, or SVG wave dividers, creates gentle transitions that mimic riverbanks and water ripples.
Even better, designers can weave a thin, continuous meander line down the center or side of the page. As the visitor scrolls, this illustrated stream path subtly draws itself forward, connecting key milestones, photos, and impact numbers along the way. Because SVG files are pure mathematical code rather than heavy video files, these fluid lines load in milliseconds without slowing down your site.
Asymmetrical Natural Balance
Walk along a real creek and you will never find three identical boulders spaced exactly four feet apart. Nature achieves harmony through asymmetrical balance, where different shapes and sizes offset one another organically.
On the web, breaking out of stiff three-column card grids makes your content feel alive. You can pair a tall vertical photo of a volunteer planting native sedges with a staggered text block and a delicate botanical sketch overlapping the margin. Organic framing, such as subtle pebble-shaped photo masks, softens sharp corners and draws attention to human faces and wildlife. Practicing storytelling with streams through asymmetrical balance, often using the principles of Wabi-Sabi Design, keeps readers visually engaged from top to bottom.
Sub-Watershed Navigation Architecture
How you organize your top navigation menu reveals who your website is really built for. Many nonprofits organize menus around internal staff departments, using labels like “Programs,” “Initiatives,” “Governance,” and “Resources.” Visitors rarely know which label hides the information they care about.
Instead, try organizing your site around recognizable local geography. A visitor who lives near Mill Creek or Sandy Run cares deeply about their specific neighborhood waterway. Creating dedicated landing pages for each major creek or sub-watershed lets residents explore local water grades, nearby trail access points, and neighborhood restoration projects. Geography-based navigation turns abstract conservation into personal pride.
Turning Technical Monitoring Data into Donor-Ready Impact Stories
Watershed associations collect extraordinary scientific data, yet numbers alone rarely move people to open their wallets. Grant reviewers love raw data tables, while everyday donors respond to clear stories of transformation. Bridging that gap is where storytelling with streams delivers its highest return on investment.
Replacing Static Tables with Interactive Storytelling
Most people do not know whether a dissolved oxygen reading of 8.5 milligrams per liter is good or bad. When websites display raw chemical spreadsheets without context, readers feel confused and tune out.
Interactive storytelling translates complex metrics into clear visual milestones. Instead of a static table, imagine a clean horizontal gauge showing how rising dissolved oxygen levels allow native brook trout and stoneflies to return to a restored stream reach. When you connect every number to a living creature or a safe swimming hole, technical data becomes an inspiring victory that donors want to fund.
Interactive GIS and Map Integration
Maps are the ultimate storytelling tool for any watershed group. Every resident wants to locate their own house, favorite fishing spot, or local park in relation to nearby creeks.
Modern web tools allow us to embed clean, fast-loading Geographic Information System, or GIS, maps directly into your pages. Visitors can click on their neighborhood sub-watershed to view simple water quality grades, see photos of completed stream bank repairs, and find upcoming volunteer workdays near their street. An interactive map transforms passive readers into active explorers.
Humanizing the Science
Data proves that your work succeeds, while human faces prove why it matters. Whenever you share an ecological benchmark, pair it right beside a candid photo of the people who made it happen.
Show the retired schoolteacher logging water temperatures at dawn, the high school science class counting macroinvertebrates, and the local farmer installing fencing to keep cattle out of the creek. Blending warm human photography with clear ecological results lies at the heart of storytelling with streams. It shows supporters that their donations empower real neighbors to care for shared water.
Low-Carbon Web Architecture: Aligning Digital Footprint with Ecological Mission
Every website consumes real electricity. Every time someone loads a webpage, data travels from a server farm through network cables to their phone or computer. Heavy, poorly coded websites burn unnecessary energy and generate avoidable carbon emissions. For an environmental organization, running a bloated website contradicts the very mission you fight to protect.
Sustainable Code Practices
Many popular drag-and-drop website themes pack dozens of bulky scripts, unused fonts, and giant unoptimized images onto every single page. A single visit to a bloated nonprofit homepage can transfer five to ten megabytes of data, slowing down browsers and wasting electricity.
At Silphium Design, we build websites using sustainable, low-carbon code architecture. We compress images into next-generation formats, write clean custom stylesheets, and eliminate heavy third-party tracking scripts. A lean website uses up to seventy percent less energy per page view than an average template site, proving your commitment to stewardship down to the server level.
Field-Ready Mobile Performance
Lightweight code is not just good for the planet; it is essential for people standing out in the field. Think about where your stakeholders actually use their phones. Paddlers check river flow gauges from boat launches, volunteers look up parking directions near rural trailheads, and landowners check invasive plant guides in wooded valleys where cell service drops to one or two bars.
If your website takes twelve seconds to load over a weak cellular connection, field users will abandon it completely. Fast, mobile-first architecture ensures that critical stream data, interactive maps, and event sign-up forms appear almost instantly, even in remote corners of your watershed. Reliable mobile speed makes storytelling with streams practical anywhere outdoors.
Accessible Design for All Stakeholders
A truly healthy watershed serves everyone in the community, and your digital hub must be just as welcoming. Web accessibility ensures that people with visual, auditory, or motor differences can navigate your site effortlessly.
Following strict Web Content Accessibility Guidelines, or WCAG, means choosing color combinations with strong readability contrast, adding descriptive alt text to every photo and map, and making sure every button works smoothly with keyboard navigation and screen readers. Accessible design also helps older donors, busy municipal officials, and local teachers read your reports without squinting. Inclusion strengthens both your community reach and your eligibility for public grants.
Structural Blueprint: From Static Annual Report to Living Watershed Hub
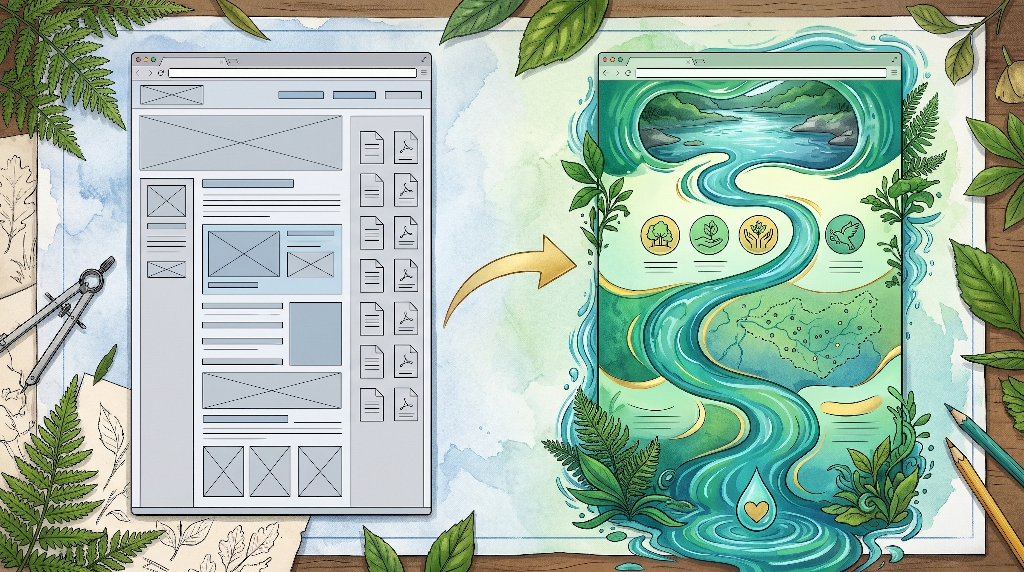
To see how all these pieces work together in practice, let us compare a typical conservation website against an organic layout engineered for impact.
Before: The Traditional Template Layout
On a standard nonprofit template, the homepage opens with a generic landscape slider that pushes important text down the screen. Below that sits a three-column row of identical gray boxes labeled “Who We Are,” “What We Do,” and “Get Involved.”
Further down, a cluttered sidebar lists six downloadable PDF newsletters from past years. The “Donate” button sits tucked inside the top navigation bar in small font, far away from any compelling story about why funds are needed. Visitors leave without feeling any urgency or emotional connection.
After: The Silphium Design Organic Layout
Now picture that same organization rebuilt using intentional storytelling with streams:
- Above the Fold: The page opens with a crisp, full-width photograph of your signature local creek framed by a subtle, organic wave mask at the bottom edge. Over a calm, high-contrast shaded area sits a clear headline explaining how your group protects clean water for fifty thousand local residents. Two distinct buttons invite immediate action: a primary button reading “Protect Our Streams” and a secondary button reading “Explore Your Watershed.”
- Mid-Page Flow: As the reader scrolls past the wave edge, a delicate teal stream line guides their eye down the page. Along this flowing path, three clean impact counters animate gently into view: 18 miles of eroding riverbank restored, 42,000 native trees planted, and 650 active community volunteers. Next to each number sits a short, plain-English story explaining how that work prevents downstream flooding and cools water for native fish.
- Interactive Data Spotlight: Further down the digital river, visitors encounter a clean, interactive sub-watershed map alongside a simple visual thermometer showing rising water quality scores over the past five years. Readers can click their own town to see nearby conservation wins without ever opening a spreadsheet.
- Bottom Conversion Zone: At the confluence of the page, the stream line flows directly into a warm, distraction-free donor card. Instead of asking for a vague contribution, the form connects specific dollar amounts to tangible ecological outcomes, such as funding ten native riparian trees or sponsoring a school water-testing kit. Supporting your mission feels like the natural next step in the journey.
Bringing Your Watershed’s Story to Life with Silphium Design
Your watershed association works tirelessly to heal damaged creeks, protect drinking water, and unite neighbors around shared natural heritage. Your website should work just as hard for you every hour of the day. When you replace rigid, outdated templates with thoughtful biophilic architecture, your digital presence stops acting like a dusty filing cabinet and starts functioning like a thriving ecosystem.
Mastering storytelling with streams brings clarity to complex science, honors the unique ecology of your region, and removes the technical friction that frustrates busy staff and potential donors. Whether you are preparing for a major capital campaign, launching a citizen science monitoring network, or simply trying to make your annual impact shine, organic web design turns passive website visitors into lifelong water advocates.
At Silphium Design, we specialize in crafting fast, low-carbon, biophilic websites for watershed associations, land trusts, and conservation leaders. We understand both the ecological science behind your work and the digital engineering required to grow your donor base.
today to schedule a complimentary Watershed Website Flow Audit, where our team will review your current site and map out practical ways to elevate your online impact. If you are planning an upcoming redesign or grant proposal, reach out through our site to request our 10-Point Biophilic UX Checklist for Conservation Nonprofits and start building a digital home worthy of the waters you protect.