
Table of Contents
The Context of Open Source Web GIS Frameworks
Caring for land is one of the oldest human responsibilities, but today it depends heavily on modern digital tools. Regional conservation land trusts protect wild forests, open meadows, clear streams, and fertile farmland. To carry out this work, these non-profit organizations must know exactly where their boundaries lie. They must understand which native plants thrive on their properties, where animals migrate, and where foot trails guide visitors through the wilderness. Decades ago, this information lived in heavy paper binders, metal filing cabinets, and hand-drawn surveyor maps. Today, spatial data lives on web servers and runs through interactive digital maps.
Connecting people to landscapes through digital screens requires thoughtful software choices. When a local land trust decides to build a web map, it faces a major fork in the road. On one side are massive commercial software platforms. These commercial systems offer polished tools right out of the box, but they charge steep annual license fees. They also impose strict usage limits and trap valuable ecological records inside closed, proprietary file systems. On the other side sits the world of modern open source tools.
Choosing open source software gives land trusts complete data sovereignty. Sovereignty means that the organization owns its digital records outright, without having to pay rent every year just to look at its own property boundaries. For a small community trust operating on donations and modest foundation grants, spending thousands of dollars every year on closed software licenses means having fewer dollars to purchase land parcels or plant native trees.
Open source Web GIS Frameworks give organizations the power to design flexible, highly capable mapping tools without ongoing vendor fees. A web GIS framework provides the foundational digital code that runs inside an internet browser to draw interactive maps, fetch geographical boundaries from databases, and let users click on trails or parcel lines. Because the source code is public and free to modify, computer programmers and conservationists around the world review, improve, and secure these platforms continuously.
Designing digital maps for land stewardship also calls for a biophilic mindset. Biophilia describes our natural, inborn desire to connect with the living world. When people view a digital map, they should not feel as though they are operating an industrial spreadsheet or a noisy cockpit. Instead, the interface should feel calm, clear, and reflective of natural geometry and outdoor spaces.
Modern Web GIS Frameworks allow developers to shape the visual tone, palette, and speed of an online map so that the interface invites visitors to explore the physical outdoors. By combining thoughtful ecological design with reliable open source tools, land trusts can safeguard their institutional independence and deliver inspiring, functional experiences to their communities.
Technical Evaluation Matrix of Front-End Geospatial Frameworks
Selecting the right software for your team begins with an honest review of what each library does best. The front end refers to the part of a website that runs directly inside the visitor’s web browser, whether that browser is Google Chrome on a desktop computer, Safari on an iPhone, or Firefox on an Android tablet. The browser has to download the computer code, process the raw boundary points, and render them on the glass screen quickly.
Different open source Web GIS Frameworks take different approaches to this work. Some prioritize tiny code files so pages load instantly over weak mobile phone signals in the woods. Other frameworks prioritize massive rendering engines that can display thousands of property lines simultaneously without slowing down. Still other libraries focus on strict adherence to international mapping standards and precise legal boundary calculations.
Here is a practical comparison of the leading open source Web GIS Frameworks used by modern land trusts:
| Framework | Download Footprint | Rendering Engine | Coordinate System Handling | Primary Conservation Role |
| Leaflet.js | Approximately 40 KB (core file) | Standard HTML SVG and Canvas 2D | Built-in support for web mercator and standard GPS coordinates | Public trail maps, nature preserve guides, donor pages |
| OpenLayers | Modular, medium to large footprint | Advanced HTML5 Canvas and WebGL | Full native support for arbitrary regional projections via Proj4js | Staff property monitoring, official legal parcel audits |
| MapLibre GL JS | Approximately 200 KB | Modern WebGL and WebGPU hardware rendering | Dynamic 3D tilt, pitch, and smooth vector rotation | Regional wildlife corridors, 3D watershed terrain models |
| TerriaJS | Large complete framework package | Dual Cesium 3D and Leaflet engines | Comprehensive multi-source spatial catalog ingestion | State-wide multi-partner conservation alliances |
Understanding how these open source Web GIS Frameworks behave under real field conditions helps technical directors pick the exact right tool for their staff and members.
Leaflet.js
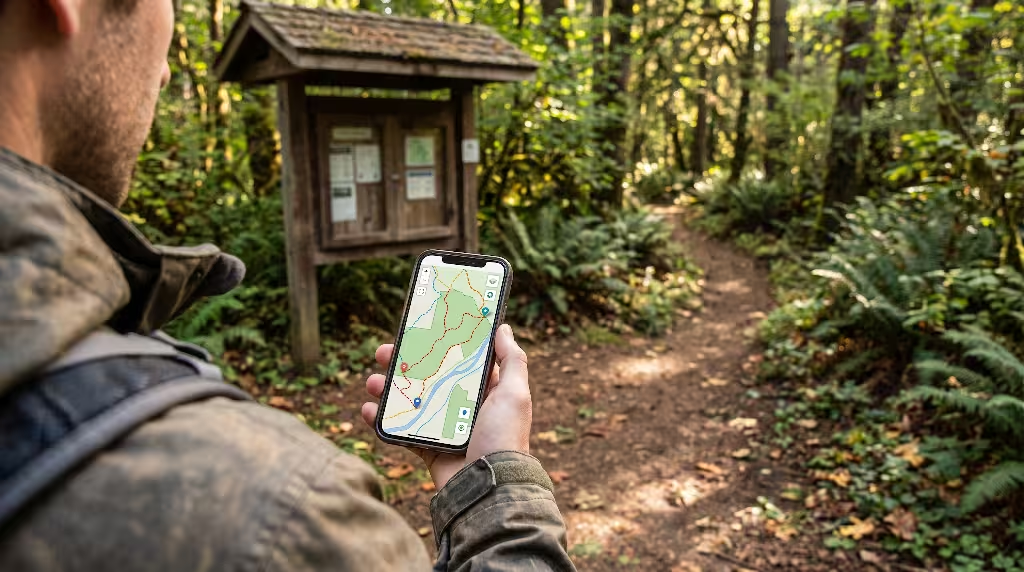
Leaflet.js is one of the most beloved and widely used open source Web GIS Frameworks in the world. Created to be simple, fast, and lightweight, Leaflet core code weighs only about forty kilobytes. That tiny file size means a web browser can download and launch the map in the blink of an eye, even when a hiker is standing by a remote trailhead with only one bar of cellular reception.
The architecture of Leaflet relies on the standard Document Object Model of the browser, drawing visual elements using Scalable Vector Graphics, commonly called SVG, and HTML5 Canvas. Because it uses familiar web elements, any developer who knows basic web development can learn Leaflet in an afternoon. You do not need an advanced engineering degree to add a hiking trail, mark parking areas, or create interactive pop-up boxes that share information about local birds and native wildflowers.
The plugin ecosystem for Leaflet is massive. If your land trust needs a search bar where visitors can type an address to find the closest protected forest, you can add a ready-made search plugin. If you have hundreds of public trail waypoints that crowd the screen when zoomed out, you can drop in a marker clustering plugin that gathers those dots into neat numeric clusters until the user zooms in closer.
However, Leaflet has technical trade-offs. Because it creates standard SVG elements for lines and shapes, its performance can drop if you ask it to render too much information at once. If your land trust attempts to draw five thousand detailed parcel boundaries on a single Leaflet screen, the web browser will often stutter and freeze. The library was never designed to process tens of thousands of complex boundary segments on the client device.
For community-facing projects, Leaflet remains one of the finest Web GIS Frameworks available. It is ideal for public preserve directories, nature walk guides, community garden registries, and donor acknowledgment maps where visual simplicity and lightning-fast loading matter most.
OpenLayers
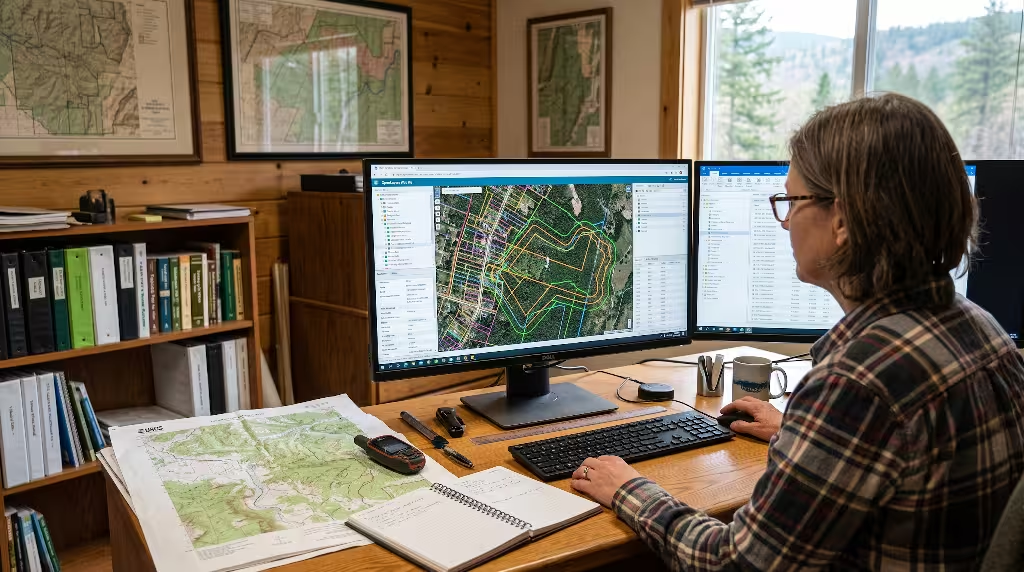
When a land trust needs industrial-strength data handling and legal boundary precision, OpenLayers is often the correct choice. Unlike lightweight libraries, OpenLayers is a comprehensive, feature-complete mapping engine built from the ground up to support complex technical applications.
One of the greatest strengths of OpenLayers is how easily it manages diverse spatial coordinate systems. In the world of conservation, surveyors record property deeds using State Plane Coordinate Systems or local survey grids rather than standard web coordinates. Standard web maps use a projection called Web Mercator, which stretches lands near the poles and distorts accurate ground distances. When legal staff must verify whether a timber harvest encroached across a conservation boundary line by two feet, using exact local coordinates is essential. OpenLayers integrates natively with projection conversion libraries like Proj4js. It can re-project incoming spatial data inside the browser smoothly, ensuring that legal parcels, easement lines, and wetland buffers line up to the exact inch.
OpenLayers relies on an advanced Canvas and WebGL rendering engine. It handles vector topology editing directly in the browser window. That means a field steward can log into an internal staff portal, click on an easement boundary line, and adjust vertex points or draw new monitoring zones directly on the map. It also natively supports standard Open Geospatial Consortium protocols like the Web Feature Service Transactional standard. This protocol lets the web browser write changes directly back to a central spatial database without needing custom intermediate programming code.
The main trade-off with OpenLayers is its learning curve and overall footprint. The framework provides an extensive programming interface with hundreds of classes and methods. It requires more technical knowledge to configure and debug. For public-facing trail visitors, OpenLayers can feel like bringing a heavy commercial tractor to a backyard flower garden. But for internal staff portals, boundary auditing, and deep analytical tasks, it stands as one of the most reliable and complete Web GIS Frameworks on the market.
MapLibre GL JS
MapLibre GL JS represents the modern frontier of high-performance web mapping. It was born as an open source community fork of Mapbox GL JS after that project shifted to a commercial license. The global geospatial community joined forces to ensure that developers would always have a free, open source vector tile rendering framework.
The architecture of MapLibre GL JS centers on WebGL and WebGPU. Instead of asking the computer’s central processor to draw every boundary line using standard webpage code, MapLibre taps directly into the computer’s graphics card. Graphics processors excel at rendering thousands of shapes, lines, and textures simultaneously at sixty frames per second. As a result, users can pan, spin, and zoom across an entire state filled with detailed land parcels without any stuttering or lag.
MapLibre works primarily with vector tiles. In older web maps, the central server glued map data into pre-rendered square image pictures called raster tiles and sent them over the internet. With vector tiles, the server sends pure compact mathematical geometry over the wire, and MapLibre styles and draws those lines live inside the browser. This allows for smooth zooming. Text labels rotate automatically so they always face the reader right side up, and colors can change dynamically based on user interaction or the time of day.
MapLibre also excels at three-dimensional terrain representation. Land trusts working in mountainous regions, rolling river valleys, or coastal cliffs can drape digital elevation models over the landscape. Staff and supporters can tilt the digital camera to view an entire watershed in realistic 3D, seeing clearly how water drains down ridges into conserved river basins.
The primary hurdle when working with MapLibre is that it requires a modern vector tile pipeline. You cannot simply point the framework to a loose folder of shapefiles and expect it to work. You need to convert your data into vector tiles using modern file formats or back-end tile servers. Once that pipeline is running, MapLibre GL JS proves to be one of the most fluid, visually stunning Web GIS Frameworks available for displaying regional landscapes.
TerriaJS and Spatial Data Infrastructure Frameworks
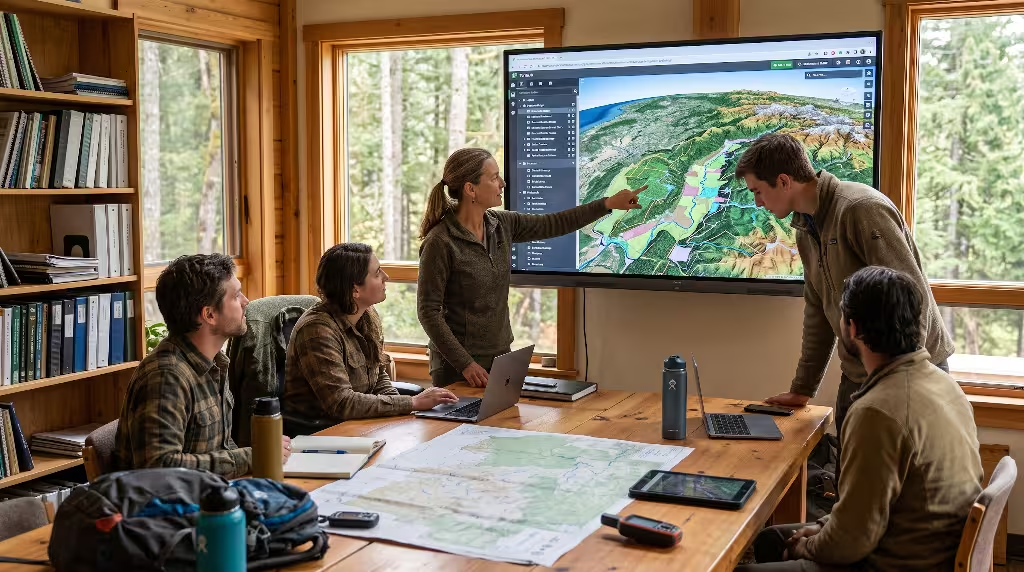
Some conservation initiatives are too large for a single land trust to manage alone. Across the country, regional conservation partnerships bring together dozens of local trusts, state agencies, indigenous nations, and university forestry departments. When multiple institutions collaborate, building a single standalone map interface is not enough. They need a comprehensive spatial data catalog.
This is where complete infrastructure frameworks like TerriaJS and GeoNode become invaluable. TerriaJS is an open source framework originally created in Australia to power large national spatial platforms. It combines both 2D map views and complete 3D digital globes by coordinating libraries like Cesium and Leaflet.
What sets TerriaJS apart from single-purpose libraries is its built-in data catalog system. Users do not merely look at a static map. They open a side tray that can search and connect to hundreds of external public data services. A conservation planner using a TerriaJS portal can leave their own parcel layer turned on while checking live external feeds from the United States Geological Survey, national wetland inventories from the Fish and Wildlife Service, and wildfire hazard models from state forestry agencies. The framework automatically parses these diverse spatial formats, displays them together, and lets users compare layers using interactive visual splitters.
Setting up and maintaining a complete spatial catalog framework requires solid server infrastructure and system administration knowledge. It is not something a small volunteer trust needs for a simple preserve guide. However, for regional watershed coalitions, coastal resilience alliances, and statewide conservation networks, these broad Web GIS Frameworks create a unified hub for landscape-scale stewardship.
The Back-End and Data Pipeline: Storage, Serving, and Vector Tiles
A front-end mapping library is only half of a functional web map. The front-end code running inside a user’s browser needs a reliable back-end system to store spatial data securely and deliver it quickly over the web.
+-----------------------------------------------------------------------+
|                         FIELD DATA INGESTION                          |
|         QField Mobile / Mergin Maps (Offline Tablet Inspections)       |
+-----------------------------------------------------------------------+
                                   |
                                   v  (Encrypted Sync)
+-----------------------------------------------------------------------+
|                         CENTRAL DATABASE                              |
|           PostgreSQL + PostGIS (Spatial Indexing & Topology)          |
+-----------------------------------------------------------------------+
                                   |
           +-----------------------+-----------------------+
           |                                               |
           v                                               v
+-------------------------------+       +-------------------------------+
|     DYNAMIC TILE SERVER       |       |   CLOUD-NATIVE STATIC TILES   |
|  GeoServer / Martin / Tegola  |       |   PMTiles on Cloud Storage    |
|   (Live WFS-T / On-the-Fly)   |       |   (Zero Server Cost / Static) |
+-------------------------------+       +-------------------------------+
           |                                               |
           +-----------------------+-----------------------+
                                   |
                                   v  (Web Mercator / Vector Geometry)
+-----------------------------------------------------------------------+
|                    FRONT-END WEB GIS FRAMEWORKS                       |
|           Leaflet.js  /  OpenLayers  /  MapLibre GL JS                |
|             (Interactive Browser UI for Staff & Public)               |
+-----------------------------------------------------------------------+
At the center of almost every open source spatial architecture sits PostgreSQL paired with the PostGIS extension. PostgreSQL is an enterprise-grade relational database, and PostGIS gives it spatial intelligence. With PostGIS, a database does not just store text names and numbers; it understands geometric shapes like points, lines, multi-polygons, and three-dimensional volumes.
PostGIS allows land trusts to run lightning-fast spatial queries using structured query language commands. An administrator can ask the database to return every parcel that touches a specific trout stream, or calculate the exact acreage of woodland that falls within a proposed wildlife corridor. PostGIS uses specialized spatial indexes called Generalized Search Trees, or GiST indexes. These indexes organize spatial shapes into bounding boxes, allowing the database to search through millions of records in milliseconds.
Once your boundaries and ecological data are safely stored in PostGIS, you need a method to deliver that geometry to your front-end Web GIS Frameworks. Traditionally, organizations ran specialized map servers such as GeoServer. GeoServer is a powerful Java application that connects to PostGIS and serves map data using international standards like Web Map Services and Web Feature Services. GeoServer also includes security tools like GeoFence, which allow administrators to set strict rules regarding who can view specific data layers.
In recent years, a modern cloud-native approach has transformed spatial data delivery through a format called PMTiles. Developed by open source engineers, a PMTile file is a single archive that holds an entire pyramid of pre-rendered vector or raster tiles. Using clever HTTP range requests, a modern web browser can ask a basic cloud storage bucket to send only the exact microscopic slice of the file needed to draw the current screen view.
This breakthrough means a land trust can generate a single PMTiles file containing all its preserve trails and boundaries, upload that file to low-cost static cloud storage, and connect it directly to front-end Web GIS Frameworks. The trust no longer needs to pay for, maintain, or update an expensive, continuously running server machine. This cloud-native pattern brings server hosting costs down to pennies per month while making the map practically immune to crashing from high web traffic.
Sensitive Species Masking and Data Security
Land trusts hold some of the most ecologically sensitive data in existence. During seasonal property surveys, biologists record the exact geographic coordinates of rare nesting raptors, ancient native stands of ginseng, endangered bog turtles, and fragile freshwater mussel beds. If a land trust mistakenly publishes the exact GPS coordinates of a rare orchid population on an open trail map, poachers or well-meaning plant collectors could arrive and destroy the colony within days.
Protecting this fragile natural heritage requires robust data obfuscation practices built directly into the spatial pipeline. Using PostGIS on the back end, data managers can create secure automated database views. Instead of sending raw species point locations to the public, the database can run functions that automatically apply spatial jittering or geometric buffering.
For instance, the system can draw a half-mile wide circular zone around a rare bird nest and display only that broad circle to the public as a general habitat study area. The exact point coordinates remain locked away in password-protected database tables accessible only to authorized staff scientists.
Furthermore, by applying Row Level Security inside the PostgreSQL database, the system ensures that when an unauthenticated public user loads one of your front-end Web GIS Frameworks, the server physically blocks any query requesting precise species locations. Protecting wildlife requires that our digital systems guard nature with the same vigilance that our field fences and boundary signs provide on the ground.
Field-to-Office Data Ingestion Pipelines
A conservation easement is a legally binding agreement between a landowner and a trust that permanently limits commercial development to protect ecological value. To fulfill their legal obligations, land trusts must inspect every single easement property at least once a year. Field monitors walk property boundaries, check for illegal dumping or timber clearing, photograph building envelopes, and document natural recovery.
In the past, monitors walked into the brush carrying clipboards, paper maps, and handheld GPS units. Back at the office, someone had to manually type those handwritten notes into desktop spreadsheets and download waypoint files using USB cables. This manual process was slow and frequently produced errors.
Modern open source field tools have completely modernized this workflow. Field staff and trained volunteers now carry mobile devices running open source applications like QField or Mergin Maps. These mobile applications are designed specifically to work alongside QGIS, the premier open source desktop GIS software. Before heading into the field, a steward synchronizes their tablet with the organization’s central PostGIS database.
While deep in the backcountry, far beyond the reach of cell towers and internet routers, the field steward uses the mobile app completely offline. The tablet uses its internal satellite receiver to track the monitor’s location along the boundary line. The steward can tap the screen to drop inspection points, record observations about fence lines or invasive plants, and snap photographs that are automatically tagged to the exact spot on the digital parcel.
When the monitor returns to the field station or their home office and connects to Wi-Fi, the mobile software synchronizes the new observations back to the central database. The updated field records instantly become available to internal Web GIS Frameworks used by desk-bound stewardship coordinators. This tight connection between offline field tools and modern web maps saves hundreds of hours of administrative labor every season.
Frequently Asked Questions about Web GIS Frameworks
When land trust leaders, board members, and volunteer tech teams begin exploring modern spatial software, they regularly run into practical questions. Here are clear answers to the most common queries surrounding open source spatial tools.
Is QGIS suitable for building web GIS applications?
QGIS is primarily an open source desktop software suite used for analyzing spatial layers, creating print maps, and editing vector shapes on a personal computer. It does not run inside a web browser by itself. However, QGIS plays an essential role in building web applications.
Using popular plugins such as qgis2web, a GIS specialist can style a complex map inside QGIS using familiar menus and buttons, and then export the entire project into ready-to-use HTML and JavaScript code powered by Leaflet or OpenLayers.
Additionally, an organization can install QGIS Server on a central computer. QGIS Server reads desktop QGIS project files directly and serves them over the web as standard OGC map services. This allows non-technical staff to update map symbology and labels on their desktop computer and have those visual changes appear immediately across the trust’s live Web GIS Frameworks without writing any custom website code.
What is the difference between Leaflet and OpenLayers for conservation work?
The core difference between these two popular open source libraries comes down to simplicity versus deep functional scope. Leaflet is a compact, streamlined library focused entirely on drawing straightforward maps smoothly on web and mobile screens. It is lightweight, friendly to work with, and exceptionally well-suited for public-facing nature preserve maps and trail navigators.
OpenLayers is a heavier, enterprise-grade mapping engine designed for complex data pipelines. It includes native support for custom map projections, advanced coordinate transformations, and in-browser topological vector editing. If your organization is building a public portal to help hikers explore local nature trails, Leaflet is almost always the easier and more efficient choice. If you are building an internal platform for staff to audit legal deeds, edit complex easement geometries, and re-project historical survey coordinates, OpenLayers provides the deeper toolset required for the job.
Can a conservation land trust operate completely free of proprietary GIS licenses?
Yes, absolutely. Many forward-thinking conservation organizations operate completely free of commercial GIS software licenses. A complete, enterprise-grade open source stack looks like this:
- Desktop Analysis and Cartography: QGIS
- Field Monitoring and Data Collection: QField or Mergin Maps
- Central Spatial Database: PostgreSQL with PostGIS
- Vector Tile Generation and Cloud Serving: PMTiles hosted on low-cost static cloud storage
- Interactive Browser Maps: Leaflet.js or MapLibre GL JS
This software combination allows an organization to perform advanced spatial analysis, monitor thousands of acres of conservation easements, maintain spotless legal records, and run public web maps at a fraction of the cost of commercial software. The money saved on annual software seats can go directly toward purchasing critical conservation lands.
How do open source web maps handle sensitive ecological and donor data?
Open source architectures secure sensitive data through layered, defense-in-depth principles. At the foundation, the PostgreSQL database uses Row Level Security and role-based access control. These security protocols ensure that public users can never access private database fields or sensitive coordinate points.
At the API and server level, developers build separate endpoints for internal staff and public visitors. Internal applications require secure login authentication, such as two-factor authentication tokens, to view donor property boundaries, unredacted monitoring reports, or exact endangered species locations. Public endpoints deliver pre-processed, generalized data layers that strip out donor names and blur exact species coordinates into broad regional zones. Because open source code is completely transparent, security researchers and independent developers continuously inspect the underlying libraries to identify and fix security flaws quickly.
Biophilic Interface Design: Grounding Digital Maps in Ecological Context
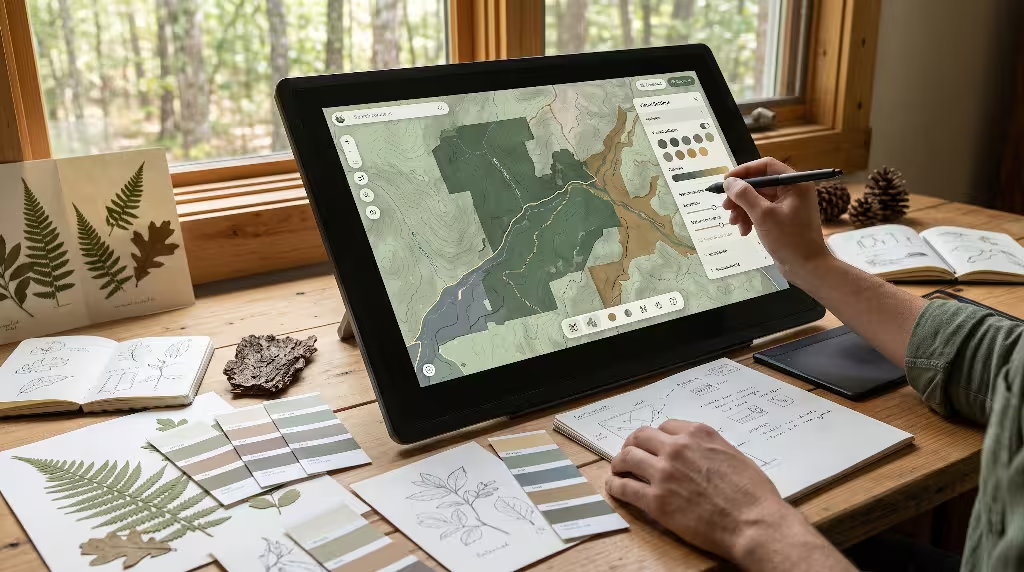
A map is not merely a technical tool; it is a visual bridge between a human being and the living earth. Biophilic design reminds us that human minds thrive when surrounded by natural patterns, textures, and rhythms. When conservation land trusts build web applications, they have a wonderful opportunity to extend their ecological values into their digital design choices.
Too many digital maps rely on generic industrial styling. They use harsh, neon colors, intense artificial contrasts, and crowded visual controls that trigger digital fatigue. A biophilically designed web map embraces natural materiality. Rather than using piercing saturated blues for water and artificial bright greens for fields, designers can select organic, muted palettes drawn directly from regional ecosystems.
Consider using deep river slate, damp woodland loam, sunlit prairie ochre, and fresh canopy green. These nature-aligned colors reduce visual strain and create a quiet, contemplative browsing atmosphere. Visitors looking at your map should feel an emotional connection to the physical terrain before they even step out the front door.
Interface clarity also plays a vital role in biophilic digital design. Natural environments feature clear pathways, soft edges, and open vistas. Digital maps should reflect these same spatial qualities. By removing unnecessary UI panels, hiding technical coordinate readouts from general visitors, and allowing the natural topology of the land to take center stage, you create a sense of digital prospect and refuge. Clean typography and intuitive navigation encourage people of all ages to explore preserves with confidence and calm focus.
Accessibility is an essential element of ethical design. A nature map must be welcoming to everyone, including individuals with color vision deficiencies. Designers should test their map palettes against recognized accessible color scales, such as the Viridis or Cividis spectrums. These specialized palettes guarantee that people with red-green colorblindness can still distinguish between a wetland marsh, a mature hardwood forest, and an active agricultural easement. Biophilic design embraces everyone in the community, inviting all people to appreciate and protect the natural world.
Implementation Roadmap and Long-Term Maintenance
Adopting modern open source tools is an exciting journey, but it requires a clear, methodical plan. Rushing into code without proper preparation can lead to disorganization and staff frustration. Here is an orderly, five-step implementation roadmap designed specifically for conservation land trusts:
+--------------------------------------------------------------------------+
|                       PHASE 1: DATA AUDIT & HYGIENE                      |
| Clean parcel boundaries, fix self-intersecting geometries inside QGIS.   |
+--------------------------------------------------------------------------+
                                    |
                                    v
+--------------------------------------------------------------------------+
|                     PHASE 2: DATABASE INFRASTRUCTURE                     |
| Migrate spatial files into a managed PostgreSQL / PostGIS database.       |
+--------------------------------------------------------------------------+
                                    |
                                    v
+--------------------------------------------------------------------------+
|                   PHASE 3: STATIC TILE PIPELINE SETUP                    |
| Convert static preserve and trail layers into modern PMTiles archives.   |
+--------------------------------------------------------------------------+
                                    |
                                    v
+--------------------------------------------------------------------------+
|                    PHASE 4: FRONT-END CLIENT ASSEMBLY                    |
| Build intuitive map interfaces using Leaflet.js or MapLibre GL JS.      |
+--------------------------------------------------------------------------+
                                    |
                                    v
+--------------------------------------------------------------------------+
|                 PHASE 5: DOCUMENTATION & ACTIVE GOVERNANCE               |
| Create simple maintenance runbooks and train non-technical staff.        |
+--------------------------------------------------------------------------+
Phase 1: Data Audit and Hygiene
Before writing a single line of web code, your team must audit its existing spatial files. Over decades of work, land trusts often accumulate messy collections of shapefiles, AutoCAD drawings, Google Earth KML files, and spreadsheets scattered across multiple office desktop computers.
Open these historical layers inside QGIS and run automated topological checks. Look for duplicate boundary lines, unclosed polygon rings, sliver gaps between adjacent parcels, and self-intersecting lines. Cleaning your spatial data at the beginning prevents rendering bugs and calculation errors down the road.
Phase 2: Database Infrastructure Setup
Once your parcel layers and trail lines are clean and verified, migrate them into a unified PostgreSQL database equipped with PostGIS. Many reliable cloud hosting providers offer managed PostgreSQL databases that take care of daily backups, operating system updates, and automated security patches.
Organize your data into clear, logical schemas. Create separate tables for fee-owned preserves, conservation easements, public walking trails, parking areas, and private staff monitoring records. Set up spatial indexes across all geometry columns to guarantee rapid query speeds.
Phase 3: Static Tile Pipeline Setup
For baseline property boundaries and hiking trails that rarely change from day to day, convert your PostGIS layers into PMTiles archives. Tools like Tippecanoe, an open source utility originally built to generate vector tiles, allow you to create beautiful, compressed tile sets with fine-tuned zoom levels.
Upload these finished PMTiles files to an affordable static object storage bucket, such as Amazon S3 or Cloudflare R2. Setting up this cloud-native pipeline ensures that your maps will serve hundreds of simultaneous visitors during community events without requiring an expensive, high-powered web server.
Phase 4: Front-End Client Assembly
With your back-end data sources securely in place, assemble your front-end web interface. If your goal is a lightweight, mobile-first trail finder, build your application using Leaflet.js. Take advantage of clean biophilic color palettes, add intuitive search boxes, and ensure pop-up cards display preserve rules, parking directions, and trail lengths clearly.
If your organization is building a regional watershed display or an internal parcel exploration system, select MapLibre GL JS or OpenLayers. Build responsive controls that work smoothly on small smartphone touchscreens as well as wide office desktop monitors.
Phase 5: Documentation and Active Governance
The long-term success of any technological project depends on people, not software. Small non-profit land trusts often experience turnover among staff, interns, and volunteer board members. If only one person understands how the organization’s web map works, that map can quickly fall into disrepair when that individual leaves.
Write clear, simple documentation in plain language. Avoid technical jargon whenever possible. Create step-by-step guides showing how a stewardship coordinator can add a newly acquired parcel or update a closed trail route. Store your front-end code in modern version control repositories, such as GitHub or GitLab, and configure automated deployment scripts. When your system is well documented, new team members can maintain and improve your mapping tools smoothly for years to come.
Synthesizing Ecological Mission with Open Web Technology
Conservation land trusts exist to preserve our natural heritage across generations. The legal agreements they sign and the land preserves they protect are intended to endure forever. The software tools they rely on to document, monitor, and celebrate these landscapes should share that same spirit of permanence and resilience.
Proprietary software companies come and go. They alter pricing models, get acquired by conglomerates, deprecate legacy tools, and lock critical community records behind proprietary paywalls. Open source Web GIS Frameworks offer a refreshing, sustainable alternative rooted in transparency, collaboration, and community ownership.
By choosing open source Web GIS Frameworks like Leaflet, OpenLayers, and MapLibre, conservation groups take full control of their spatial data destiny. When combined with rock-solid back-end tools like PostGIS and lightweight cloud-native formats like PMTiles, these mapping tools deliver extraordinary visual performance at minimal ongoing cost.
Furthermore, by weaving the principles of biophilic design into their user interfaces, land trusts can build digital maps that honor the beauty, balance, and quiet majesty of the natural landscapes they work so hard to protect. These thoughtful digital maps do more than display boundary points on a glass screen; they invite people to step outside, walk the trails, breathe the clean forest air, and fall in love with the land.