The user experience for any location-based service often hinges on a single, critical element: the map. We have all encountered its failure point—a static, low-resolution image of a service area or a store locator that is fundamentally useless for navigation or interaction. This common frustration highlights a significant disconnect between data presentation and user utility. The solution is not a better image, but a fundamentally different technology. This is where we must look to a Geographic Information System, or GIS, a comprehensive framework for capturing, storing, analyzing, and managing all forms of spatial and geographic data.
This article serves as a technical introduction to GIS in web design, shifting the paradigm from static representations to dynamic, data-rich environments. The integration of GIS is no longer a niche practice reserved for cartographers and urban planners; it has become a powerful and increasingly necessary tool for developers and designers. By embedding GIS capabilities directly into a website’s architecture, we can create intuitive, interactive, and analytically potent user experiences that provide genuine value and drive engagement. The following sections will deconstruct the technology, outline its benefits, and provide a functional roadmap for its implementation.
Table of Contents
What is the Role of GIS in Web Development?
The role of GIS in web development is to fundamentally transform a map from a static picture into a dynamic, queryable database with a visual interface. Unlike a simple embedded image, a GIS-powered map, often called a Web GIS, is a layered system. The base layer is the map itself—the coastlines, borders, and streets—but the crucial components are the operational layers of spatial data that sit on top. Each point, line, or polygon on the map represents a record in a database that can be queried, filtered, and analyzed in real-time.
This enables two primary functions. First, data visualization: A website can render complex datasets, such as sales territories, demographic shifts, or environmental sensor readings, onto a map, making intricate information immediately comprehensible. Second, spatial analysis: The system can answer geographic questions. For example, a user can ask, “Show me all properties for sale within a two-mile radius of this school,” or “Which of our service technicians is closest to this client’s location?” This transition from a simple graphic to an analytical tool is the core of modern web mapping and the foundation of location intelligence in the digital space.
The Tangible Benefits of GIS Integration in Web Design

Integrating GIS is not merely a technical exercise; it produces quantifiable improvements in user experience, data communication, and business metrics.
- Enhanced User Experience (UX): Interactive maps significantly reduce cognitive load. Instead of parsing long lists of addresses or locations, users can intuitively understand spatial relationships at a glance. The ability to pan, zoom, and interact with data points provides a sense of control and discovery that is far more engaging than a passive display. This direct manipulation of information leads to a more efficient and satisfying user journey.
- Improved Data Communication: GIS is a powerful storytelling medium. An organization can use a time-enabled map to show its growth over decades, or a non-profit can visualize the impact of its work in a community. For data-heavy industries like real estate or logistics, complex information regarding property features, pricing tiers, or supply chain routes can be layered and filtered, allowing users to deconstruct complexity and focus only on the data relevant to their query. The map becomes the primary vehicle for clarity.
- Increased Engagement and Conversion: Interactive systems command user attention. Web analytics consistently show that pages incorporating well-executed interactive maps have lower bounce rates and higher average session durations. This sustained engagement creates more opportunities for conversion. By embedding calls-to-action directly within map features (e.g., a “Schedule a Viewing” button in a property pop-up or “Get Directions” on a store marker), the path from information discovery to user action becomes seamless and immediate.
Key Technologies and Tools for Web GIS
A functional Web GIS relies on a stack of specialized technologies. Selecting the correct tools is contingent upon project requirements, from simple locators to complex analytical platforms.
- Web Mapping Libraries (Client-Side): These JavaScript libraries are responsible for rendering the map and its data in the user’s browser.
- Leaflet.js: An open-source, mobile-friendly library prized for its lightweight footprint (around 40KB) and simplicity. It is the ideal choice for common mapping tasks where performance and ease of use are paramount.
- Mapbox GL JS: A high-performance library that uses WebGL to render highly customizable vector tiles. It excels in sophisticated cartographic styling and fluid user interactions, making it a preferred tool for design-forward applications.
- OpenLayers: A robust, feature-rich open-source library that supports a vast array of data formats and projections. Its power lies in its versatility, making it suitable for complex applications that need to integrate data from disparate GIS sources.
- GIS Platforms & APIs: These provide the backend infrastructure, data hosting, and advanced processing capabilities.
- ArcGIS API for JavaScript (Esri): This is the industry-standard enterprise solution from Esri. It provides unmatched capabilities for complex spatial analysis, 3D visualization, and integration with the broader ArcGIS ecosystem.
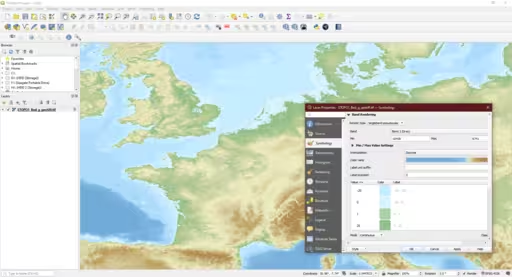
- QGIS: While primarily a desktop GIS application, QGIS is an indispensable open-source tool for preparing, cleaning, and converting spatial data before it is published to the web. Its plugins, such as QGIS2Web, can even generate basic web maps directly.
- Google Maps Platform: A ubiquitous and developer-friendly platform that offers reliable APIs for geocoding, routing, and place information, making it a common choice for applications that require these specific services.
- Data Formats: The interoperability of Web GIS depends on standardized data formats.
- GeoJSON: A lightweight format based on JavaScript Object Notation (JSON) that has become the de facto standard for web mapping. Its simple structure is easily parsed by JavaScript libraries.
- KML (Keyhole Markup Language): An XML-based format used primarily by Google Earth.
- Shapefiles: A legacy vector data format from Esri. While still common in the desktop GIS world, it must be converted to a web-friendly format like GeoJSON for use in browsers.
How Do I Create a GIS Website? A Practical Workflow
Developing a web map follows a structured, logical process from concept to deployment. While the specifics vary with the technology stack, the core phases remain consistent.
- Define the Goal: The initial and most critical step is to articulate the map’s purpose. Is it a store locator intended to drive foot traffic? A data dashboard for internal analysis? A public-facing resource for civic information? A clear objective dictates every subsequent decision.
- Data Acquisition & Preparation: A map is only as good as its data. This phase involves sourcing geographic information—from public portals like the U.S. Census Bureau, collaborative projects like OpenStreetMap, or by creating it proprietary. The raw data must then be processed. This often involves using a desktop tool like QGIS to clean inaccuracies, join tables, and standardize attributes before exporting it into a web-ready format, typically GeoJSON.
- Choose Your Technology Stack: Based on the project’s goals, select the appropriate tools. For a simple, fast interactive map, the combination of Leaflet.js and GeoJSON files is often sufficient. For a map requiring high-end design and custom base layers, Mapbox is a superior choice. For enterprise-level analysis, the ArcGIS API is necessary.
- Development & Design: This is the implementation phase. A developer first establishes the map container in HTML and styles it with CSS. Then, using JavaScript, they initialize the chosen map library (e.g., Leaflet.js), point it to a basemap source, and load the prepared GeoJSON data as an interactive layer. Functionality such as custom markers, pop-up windows, and event listeners (e.g., “on click”) are then coded.
- Testing & Optimization: Finally, the application must be rigorously tested. Performance is key; maps with large datasets can be slow to load on less powerful devices. Ensure the design is fully responsive, providing a functional experience on both desktop and mobile screens. Test all interactive features across different browsers to ensure cross-compatibility.
Real-World Examples: GIS in Web Design in Action
The application of GIS in web design is extensive and spans nearly every industry.
- E-commerce & Retail: Store locator maps that not only show locations but also allow users to filter by services offered, view store hours, and click to get real-time driving directions via an integrated routing API.
- Real Estate: Zillow and Redfin are prime examples. Their platforms are built around interactive maps that display property listings. Users can draw custom search areas and filter results by dozens of attributes stored in a spatial database.
- Travel & Tourism: Websites like AllTrails use GIS to display hiking trails, showing elevation profiles, trailheads, and user-submitted photos geo-tagged to specific points along the path.
- Government & Urban Planning: Municipal websites use GIS to show citizens zoning regulations, property assessment values, locations of public services, and real-time data like snowplow trackers or active construction permits.
- Environmental Science: Organizations like the National Oceanic and Atmospheric Administration (NOAA) use web maps to visualize real-time weather patterns, sea-level rise projections, and historical hurricane tracks for public awareness and scientific research.
Biophilic Design Principles in Digital Mapping
My core expertise at Silphium Design is in biophilic design—the practice of connecting people with nature. This principle extends powerfully into the digital realm, particularly in cartography. A map is an abstraction of the physical world; by designing it with biophilic principles, we can make that abstraction feel more intuitive and humane.
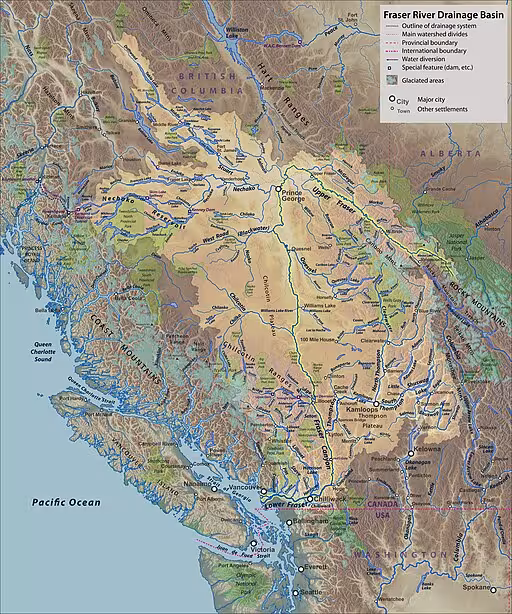
- Connecting to Nature through Data: The most direct application is using GIS to display natural elements. A map that clearly visualizes parks, water bodies, tree canopies, and topographic relief provides an indirect connection to nature. This reinforces our innate understanding of landscape and makes the map easier to read.
- Natural Analogues in Map Design: We can infuse map aesthetics with patterns and colors that mimic the natural world. Instead of using harsh, primary colors, a biophilic map palette employs earth tones, soft greens, and water blues. Region fills can use subtle textures that evoke paper, wood, or stone. Markers and icons can be designed with organic, softer shapes rather than rigid geometric forms, reducing cognitive fatigue.
- Prospect-Refuge Theory in UX: This theory posits that humans have a preference for environments where they can see without being seen (prospect) and have a place of safety (refuge). In web map design, “prospect” is the ability to zoom out and see the entire geographic context. “Refuge” is the ability to zoom in on a single point and receive clear, uncluttered, and actionable information in a pop-up. A well-designed map allows the user to transition seamlessly between this broad overview and a safe, focused detail view.
Conclusion: The Future of a Mapped Web
We have moved far beyond the era of the static map image. As demonstrated, a proper introduction to GIS in web design reveals a discipline focused on creating dynamic, analytical, and deeply interactive user experiences. By leveraging the correct technologies to visualize spatial data, designers and developers can communicate complex information with unparalleled clarity, drive user engagement, and embed powerful analytical tools directly into a website. The future promises even deeper integration, with real-time data streams, interactive 3D web maps, and augmented reality overlays becoming standard. To master GIS is no longer a niche skill for cartographers; it is an essential competency for any creator seeking to build a more effective, intuitive, and meaningful digital world.