
Table of Contents
When we talk about environmental impact, we usually picture smoke stacks, plastic waste, or diesel engines. We rarely think about text files, image scripts, or digital networks.
Yet the internet is the largest machine ever built by humanity. Every single web page click sets off a chain reaction across power grids across the world. When a browser requests a web page, physical server hardware spins up, network routers pulse with optical signals, and end-user screens light up. All of these actions draw electricity from real-world power plants.
If you manage a digital brand, understanding how to measure your website carbon footprint is no longer just a nice secondary goal. It is a vital engineering performance metric and a core requirement for modern sustainability reporting. This technical guide explains the exact science, math, and engineering strategies required to calculate your website carbon footprint in grams of carbon dioxide equivalent per pageview.
Introduction & Context
The Environmental Footprint of the Invisible Web
The digital world feels weightless, but its real physical backbone is massive. The global digital ecosystem currently accounts for roughly 3.7 percent of all global greenhouse gas emissions. This matches the total global carbon output of the entire commercial aviation industry. Every time a user opens a page, data moves across thousands of miles of glass fiber optic cable and copper wires to reach their screen.
Many companies work hard to lower their physical office emissions while ignoring their digital infrastructure. However, as international standards for corporate sustainability grow stricter, Scope 3 indirect emissions must be accounted for. Your website carbon footprint falls directly under these digital Scope 3 emissions. Measuring your website carbon footprint per pageview provides a clear baseline metric. This metric lets your engineering and design teams set real targets for carbon reduction.
+-----------------------------------------------------------------------+
|                       GLOBAL EMISSIONS CONTEXT                        |
+-----------------------------------------------------------------------+
|  Aviation Industry      [████████████████████████] ~2.5% - 3.5%        |
|  Digital Infrastructure [█████████████████████████] ~3.7%              |
+-----------------------------------------------------------------------+
The Main Premise: Data Transfer as an Energy Proxy
How do we measure something we cannot see? In digital sustainability, we use data transfer volume as a proxy for electrical energy consumption. Moving a byte of data across a network requires a predictable amount of work from electrical circuits. Larger file sizes require more electrical work, which generates higher carbon emissions.
To measure your website carbon footprint, we look at the total weight of data transferred during a single page load. We measure this weight in Megabytes or Gigabytes. We then convert that data volume into kilowatt-hours of electrical energy. Finally, we convert that electrical energy into grams of carbon dioxide equivalent (gCO2e). By standardizing this value to a single pageview (gCO2e/pageview), you can compare pages of different sizes and track performance changes over time.
Basic Methodology — The Sustainable Web Design Model (SWD v4)

System Boundaries: Operational vs. Embodied Emissions
To calculate a website carbon footprint accurately, we must follow a standardized scientific framework. The industry standard is the Sustainable Web Design Model Version 4. This model uses a comprehensive approach to account for all emissions generated across the complete digital lifecycle.
The SWDM v4 framework splits digital emissions into two main categories:
- Operational Emissions: The real-time electrical energy used to process, transmit, and render data when a user loads a web page. This includes the electricity that powers data center servers, network routers, cell towers, and user devices.
- Embodied Emissions: The carbon emissions created during the manufacturing, raw material extraction, transportation, and eventual disposal of hardware. Every server, router, and smartphone carries a carbon debt from its creation. A complete calculation of your website carbon footprint must account for a fraction of that hardware manufacturing cost every time data is transferred.
                  SUSTAINABLE WEB DESIGN MODEL (SWDM v4)
                                    |
          +-------------------------+-------------------------+
          |                                                   |
  OPERATIONAL EMISSIONS                              EMBODIED EMISSIONS
(Real-time grid electricity)                       (Hardware manufacturing)
          |                                                   |
          +-------------------------+-------------------------+
                                    |
               TOTAL WEBSITE CARBON FOOTPRINT PER PAGEVIEW
System Segment Allocation Breakdown
Energy consumption does not happen in a single place. The SWDM v4 model divides energy usage across three main system segments. Each segment represents a distinct part of the internet infrastructure:
- Data Centers (22% of total energy): The physical facility servers where web files, databases, and media are hosted and processed.
- Telecom Networks (24% of total energy): The broad transmission network of fiber optic cables, switches, repeaters, and cellular towers that move data across the globe.
- User Devices (54% of total energy): The laptops, desktop computers, tablets, and mobile phones used by visitors to render HTML, process JavaScript, and display graphics.
Notice that user devices account for more than half of the total energy footprint. When you optimize page weight, you are not just saving server resources. You are saving battery power and screen energy on your visitors’ devices.
| Infrastructure Segment | System Energy Share | Operational Intensity (kWh/GB) | Embodied Intensity (kWh/GB) | Total Energy Intensity (kWh/GB) |
| Data Centers | 22% | 0.055 | 0.012 | 0.067 |
| Telecom Networks | 24% | 0.059 | 0.013 | 0.072 |
| User Devices | 54% | 0.080 | 0.081 | 0.161 |
| Combined System Total | 100% | $0.194 | 0.106 | 0.300 |
Under the SWDM v4 standard, the total energy required to process and transfer one Gigabyte of web data across the complete system is 0.300 kWh per Gigabyte.
Mathematical Formula & Step-by-Step Calculation
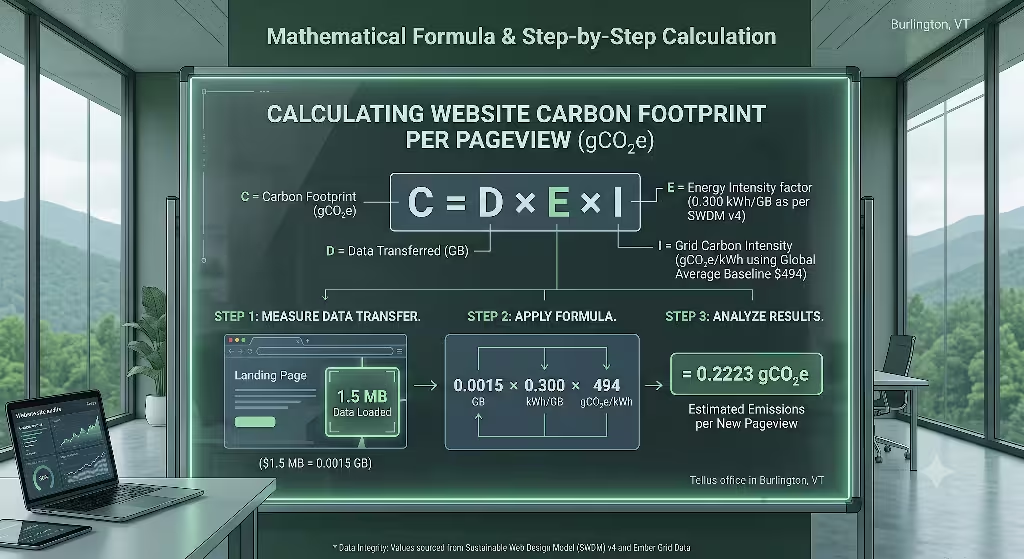
The Fundamental Formula
To find the website carbon footprint for a single pageview, we use a clear mathematical formula. This equation links page weight directly to energy usage and electrical grid carbon intensity.
C = D X E X I
Where:
- C = Total website carbon footprint per pageview in grams of carbon dioxide equivalent (gCO2e).
- D = Total data transferred for the page view in Gigabytes (GB). Note that 1 Megabyte (MB) = 0.001 Gigabytes (GB).
- E = Combined system energy intensity factor, established as 0.300 kWh/GB by SWDM v4.
- I = Carbon intensity of the electricity grid measured in grams of CO2 equivalent per kilowatt-hour (gCO2e/kWh).
Defining Grid Carbon Intensity ($I$)
The carbon footprint of electricity depends heavily on how that electricity is generated. Powering a web server with solar energy produces far fewer carbon emissions than powering it with a coal plant.
       GLOBAL vs LOCAL GRID INTENSITY COMPARISON

  Global Average Baseline (Ember Data)
  [████████████████████████████████████████] 494 gCO2e/kWh

  US National Average Grid
  [█████████████████████████████] 368 gCO2e/kWh

  Renewable Hydro/Wind Dominated Grid (e.g., Vermont)
  [████] 40 gCO2e/kWh
When calculating a global baseline website carbon footprint, SWDM v4 uses the worldwide average electrical grid intensity. According to global energy data from Ember, the global average grid intensity factor is 494 gCO2e/kWh.
If you know the exact physical location of your web hosting data center, you can use local regional grid intensity numbers instead. However, using the global average baseline ensures your website carbon footprint metric stays consistent when comparing your site to global benchmarks.
Factoring in Visitor Behavior & Caching Dynamics
Not every visitor downloads every byte of a web page from scratch. When a user returns to a web page they recently viewed, their browser loads stored assets like images, stylesheets, and scripts directly from its local memory cache. This process requires zero network data transfer for those cached assets.
To calculate an accurate website carbon footprint across real traffic, we must adjust for returning visitors and browser caching.
The standard SWDM v4 visitor model uses these baseline assumptions:
- New Visitors: 75% of total pageviews (Rnew = 0.75). These visitors download 100% of the page payload data (Dnew).
- Returning Visitors: 25% of total pageviews (Rreturn = 0.25). These visitors reload the page with cached assets, saving an average of 60% of the payload data. They only download 40% of the original page weight (Dreturn = Dnew X 0.40).
To adjust your overall website carbon footprint for caching, we calculate a weighted average data transfer volume:
Dweighted = (Dnew X 0.75) + (Dnew X 0.40 X 0.25)
Dweighted = Dnew X (0.75 + 0.10) = Dnew X 0.85
This simple multiplier shows that browser caching reduces average page data transfer by roughly 15% across all visitors.
Green Energy Hosting Factor Adjustments
If your website hosts its files in a data center certified to run on 100 percent renewable electricity, your hosting operational emissions drop significantly.
Remember from our system allocation table that data center operational energy represents 18.3 percent of total system energy (0.055 kWh/GB out of 0.300 kWh/GB). When your host is verified by the Green Web Foundation, you can apply a green hosting discount to that specific server operation segment.
The adjusted energy intensity formula for green hosting becomes:
Egreen = Etotal – Edata center operational
Egreen = 0.300 kWh/GB – 0.055 kWh/GB = 0.245 kWh/GB
Using certified green hosting reduces your overall website carbon footprint by over 18 percent right out of the box, even before you optimize a single image file.
Applied Calculation Example
Let us work through a complete step-by-step example. Suppose we have a standard landing page with a file weight of 2.0 MB.
Step 1: Convert page weight to Gigabytes.
Dnew = 2.0 MB} / 1000 = 0.002 GB
Step 2: Apply the visitor caching multiplier (85%).
Dweighted = 0.002 GB} X 0.85 = 0.0017 GB
Step 3: Calculate energy used using standard energy intensity (0.300 kWh/GB).
Energy = 0.0017 GB} X 0.300 kWh/GB = 0.00051 kWh
Step 4: Convert energy to carbon emissions using the global grid baseline (494 gCO2e/kWh).
C = 0.00051 kWh} X 494 gCO2e/kWh = 0.25194 gCO2e
Your resulting website carbon footprint for this 2.0 MB page is 0.252 grams of CO2 per pageview.
Commonly Asked Questions about Website Carbon Footprint
How many grams of CO2 does an average website produce per pageview?
The global average website carbon footprint sits between 0.35 grams and 0.50 grams of CO2 per pageview.
According to public data archive tracking from HTTP Archive, the median desktop web page transfers approximately 2.4 MB of data on initial load. Applying the standard SWDM v4 formula to a 2.4 MB page yields approximately 0.302 gCO2e for a cached view, or 0.355 gCO2e for an uncached view.
       PAGEVIEW CARBON EMISSIONS SPECTRUM

  [A+ Rating] Optimized Minimalist Page (<0.5 MB)
  |█ 0.05g - 0.08g

  [Industry Average] Median Web Page (2.4 MB)
  |███████ 0.35g - 0.45g

  [Unoptimized] Heavy Media-Rich Page (>6.0 MB)
  |██████████████████████ 1.00g - 2.00g+
Pages heavy with uncompressed media, auto-playing video banners, and unoptimized tracking scripts frequently exceed 1.50 grams of CO2 per pageview. On the other hand, well-optimized minimalist websites can keep their website carbon footprint below 0.08 grams of CO2 per pageview.
How do I calculate total annual website carbon emissions?
To scale your pageview metric up to total annual website carbon footprint emissions, multiply your single pageview metric by your total annual pageview traffic volume.
Here is the master equation for annual emissions:
Annual Emissions (kg CO2e = Cpageview X Vannual/1000
Where:
- Cpageview = Your average website carbon footprint per pageview in grams.
- Vannual = Your total annual pageviews recorded in web analytics.
- Division by 1000 converts the total value from grams to kilograms.
Practical Example:
Suppose your site receives 100,000 pageviews per month (1,200,000 views per year) and has an average website carbon footprint of 0.40 gCO2e per view:
Annual Emissions = 0.40 g X 1,200,000/1000 = 480 kg CO2e per year
A annual footprint of 480 kg of CO2 is equivalent to driving an average gas-powered car for roughly 1,200 miles.
What automated tools measure website grams CO2 per pageview?
You do not need to calculate these equations by hand for every page on your site. Several reliable, open-source automated tools can test your pages and calculate your website carbon footprint automatically:
- CO2.js (by The Green Web Foundation): An open-source JavaScript library that developers can install via npm. It powers carbon estimations in custom dashboards, software build pipelines, and performance tools.
- Website Carbon Calculator: A popular web auditing tool created by Wholegrain Digital. It uses SWDM v4 logic to scan a public URL and return instant carbon metrics.
- Ecograder: A web sustainability rating engine built by Mightybytes that evaluates page performance, user experience, and overall website carbon footprint metrics.
- Google Lighthouse Integration: While Lighthouse does not display carbon metrics directly in its standard panel, third-party plugins use Lighthouse performance payload numbers to estimate page carbon footprints automatically.
What is the difference between SWD v3 and SWD v4 calculation models?
The Sustainable Web Design Model was updated from Version 3 to Version 4 to reflect newer scientific research and updated global energy statistics.
Key changes between versions include:
- Separation of Operational and Embodied Carbon: SWD v3 grouped manufacturing costs into a single overall factor. SWD v4 breaks down operational energy and embodied manufacturing carbon separately across every single system segment.
- Updated Electrical Grid Data: SWD v4 uses updated grid intensity statistics from the Ember global energy dataset (494 gCO2e/kWh), replacing older data inputs.
- Adjusted Segment Energy Weights: SWD v4 shifts a larger share of overall system energy consumption to user devices (54%). This change highlights the carbon impact of client-side JavaScript execution and device battery drain.
- Refined Green Hosting Adjustment: SWD v4 applies the green hosting discount strictly to the operational energy segment of data centers, rather than applying a broad blanket discount across the entire ecosystem footprint.
Developer Implementation — Automating CO2 Metrics in CI/CD
Programmatic Tracking with CO2.js
To maintain a low website carbon footprint over time, digital teams should treat web carbon metrics like software regression tests. By integrating automated tools directly into your build pipeline (CI/CD), you can automatically evaluate your website carbon footprint every time a developer submits new code.
The official @tgwf/co2 JavaScript library from the Green Web Foundation allows you to compute page carbon footprints directly inside Node.js testing scripts.
                   CI/CD AUTOMATED CARBON AUDITING PIPELINE

  [ Code Commit ] ---> [ Build Page ] ---> [ Measure Byte Size ]
                                                 |
                                                 v
  [ Build Pass/Fail ] <--- [ Compare Budget ] <--- [ Run CO2.js Node Script ]
Code Blueprint Example
Below is a complete, working Node.js script showing how to calculate a website carbon footprint programmatically using the official CO2.js package.
JavaScript
// Import the co2 library from The Green Web Foundation package
import { co2 } from '@tgwf/co2';

// Initialize the carbon calculation model using SWDM v4 (default)
const swdmModel = new co2({ model: 'swd', version: 4 });

/**
 * Calculates the website carbon footprint for a given page payload
 * @param {number} bytesTransferred - The total page payload in bytes
 * @param {boolean} isGreenHost - True if hosting is verified renewable
 * @returns {object} Calculated carbon footprint metrics
 */
function auditPageCarbonFootprint(bytesTransferred, isGreenHost = false) {
    // Calculate carbon emissions in grams CO2e for a single page view
    const emissionsGrams = swdmModel.perByte(bytesTransferred, isGreenHost);

    // Convert bytes to Megabytes for clean logging
    const pageWeightMB = (bytesTransferred / (1024 * 1024)).toFixed(2);

    return {
        payloadMB: pageWeightMB,
        greenHosting: isGreenHost,
        gramsCO2PerView: emissionsGrams.toFixed(4)
    };
}

// Example 1: Audit a standard 2.5 MB page on standard hosting
const standardPageBytes = 2.5 * 1024 * 1024;
const standardResult = auditPageCarbonFootprint(standardPageBytes, false);

console.log(`Page Size: ${standardResult.payloadMB} MB`);
console.log(`Green Host: ${standardResult.greenHosting}`);
console.log(`Website Carbon Footprint: ${standardResult.gramsCO2PerView} gCO2e/pageview\n`);

// Example 2: Audit an optimized 0.8 MB page on certified green hosting
const optimizedPageBytes = 0.8 * 1024 * 1024;
const optimizedResult = auditPageCarbonFootprint(optimizedPageBytes, true);

console.log(`Optimized Page Size: ${optimizedResult.payloadMB} MB`);
console.log(`Green Host: ${optimizedResult.greenHosting}`);
console.log(`Website Carbon Footprint: ${optimizedResult.gramsCO2PerView} gCO2e/pageview`);
By running a script like this during continuous deployment, your team can automatically reject any software code updates that push your page weight or website carbon footprint beyond your set performance target.
Actionable Engineering Strategies to Lower CO2/Pageview

Calculating your website carbon footprint is only the first step. The real goal is lowering that footprint through smart digital engineering and thoughtful design choices.
                  CARBON REDUCTION STRATEGY MATRIX

  +----------------------------------------------------------------+
  |  FRONT-END           |  SERVER & INFRASTRUCTURE  |  HOSTING    |
  +----------------------+---------------------------+-------------+
  |  • WebP/AVIF Images  |  • Brotli Compression     |  • 100%     |
  |  • System Fonts      |  • Edge CDN Distribution  |    Renewable|
  |  • Lazy Loading      |  • Aggressive Caching     |    Green    |
  |  • Tree-Shaking JS   |  • HTTP/3 Protocol        |    Host     |
  +----------------------------------------------------------------+
Front-End Optimization Strategies
Front-end asset weight is usually the single largest contributor to a high website carbon footprint. Focus on these core areas to reduce client-side payload:
- Next-Gen Image Formats: Traditional image formats like PNG and JPEG are unnecessarily heavy. Converting images to WebP or AVIF formats reduces file sizes by 30 to 50 percent with zero loss in visual quality.
- Responsive Image Sizing: Avoid serving full-size 3000-pixel raw images to mobile device screens. Use the HTML
<picture>element orsrcsetattribute to serve appropriately sized images based on the user’s display width. - Native Lazy Loading: Add the
loading="lazy"attribute to all images and iframe embeds located below the page fold. This prevents browsers from downloading media until the user actually scrolls down to see it. - Font Optimization: Modern web custom fonts can add hundreds of kilobytes of data. Switch to native system font stacks where possible. If custom brand fonts are required, use compressed WOFF2 formats, subset the font file to include only required character sets, and limit the number of font weights used.
- Code Minification and Tree-Shaking: Remove dead code, unused JavaScript libraries, and redundant CSS blocks. Minify HTML, CSS, and JS files to strip out white space and developer comments before deployment.
Server and Infrastructure Optimizations
Optimizing your server setup reduces network data overhead and speeds up delivery times:
- Enable Brotli Compression: Ensure your web server compresses text files using Brotli compression instead of older Gzip algorithms. Brotli yields 15 to 25 percent smaller file transfer sizes for HTML, CSS, and JS.
- Leverage Edge Content Delivery Networks (CDNs): Route user requests through a modern CDN. Edge networks serve cached page assets from servers located physically close to the end user. This shortens network transit distances across global fiber cables, reducing overall transmission network energy use.
- Implement Strict Cache Headers: Set aggressive Cache-Control header rules for static assets. Allowing returning visitors to store image and script assets locally eliminates network transfer requirements on repeat visits.
Transitioning to Certified Green Hosting
Infrastructure hosting choices directly impact your operational data center footprint. Verify your web host against the public registry maintained by the Green Web Foundation.
A certified green host proves that its data centers are powered by renewable energy contracts, on-site solar/wind generation, or high-quality power purchase agreements (PPAs). Switching to green hosting instantly reduces the operational data center portion of your website carbon footprint calculation down to zero.
Final Thoughts & Strategic Next Steps
Summary of Key Takeaways
Measuring and reducing your website carbon footprint is a clear, repeatable engineering process grounded in physical energy math.
- Digital emissions are real: Internet operations account for roughly 3.7 percent of global greenhouse gas emissions, matching commercial air travel.
- Data weight equals carbon output: The Sustainable Web Design Model (SWDM v4) sets a standard energy intensity benchmark of 0.300 kWh per Gigabyte transferred.
- The calculation formula is direct: Multiply your cached page weight in Gigabytes by total energy intensity (0.300 kWh/GB) and grid carbon intensity (494 gCO2e/kWh) to calculate your website carbon footprint per pageview.
- Optimization improves everything: Lowering page weight reduces your website carbon footprint while simultaneously boosting page load speeds, improving SEO rankings, and enhancing user retention.
Silphium Design LLC Consultation
At Silphium Design LLC, we help clients design and build high-performance digital platforms that prioritize speed, user accessibility, and environmental responsibility. Reducing your digital environmental footprint does not mean sacrifice. It means creating lean, efficient code and smart user interfaces that serve people and the planet better.
Whether you need a complete website carbon footprint audit, CI/CD pipeline automation, or custom green web development, our engineering team is ready to help you lower your digital footprint with scientific rigor.