Table of Contents
The Annual Report Graveyard
Every autumn, land trust teams across the country enter the same exhausting sprint. Biologists pull GIS acreage totals from conservation databases. Field stewards count native plant species, invasive species removals, and miles of restored stream buffers. Development officers double-check hundreds of donor names so nobody gets left off the supporter list.
After months of hard work, your team exports a 35-megabyte static PDF, uploads it to your website, and sends a link to your email list. Then, almost nothing happens. Most supporters never download the file, and the few who do close it after ten seconds. That carefully crafted document ends up sitting unread in digital folders, turning months of passion into an annual report graveyard.
This outcome reveals a deep ecological disconnect between what land conservancies do and how they communicate. Out in the field, your organization protects living, breathing ecosystems. You steward dynamic watersheds, diverse native meadows, old-growth forests, and wildlife corridors that change with every season.
Yet when it comes time for visualizing your impact, most land trusts trap those vibrant stories inside rigid, flat, lifeless blocks of ink and pixels. A static PDF treats a thriving wetland like a tax form. It flattens rich landscape stories into tiny charts and cramped columns that fail to spark curiosity or wonder.
Replacing static PDFs with interactive web experiences transforms annual reporting from an administrative chore into a year-round fundraising engine. When you shift toward visualizing your impact directly in a web browser, donors can explore protected parcels, watch habitats recover over time, and give at the exact moment they feel inspired.
At Silphium Design, we specialize in biophilic web design that builds living digital habitats for conservation organizations. By aligning your digital presence with the natural world you protect, visualizing your impact becomes the most powerful tool in your fundraising kit.
The Hidden Costs of Static PDF Stewardship Reports for Land Conservancies
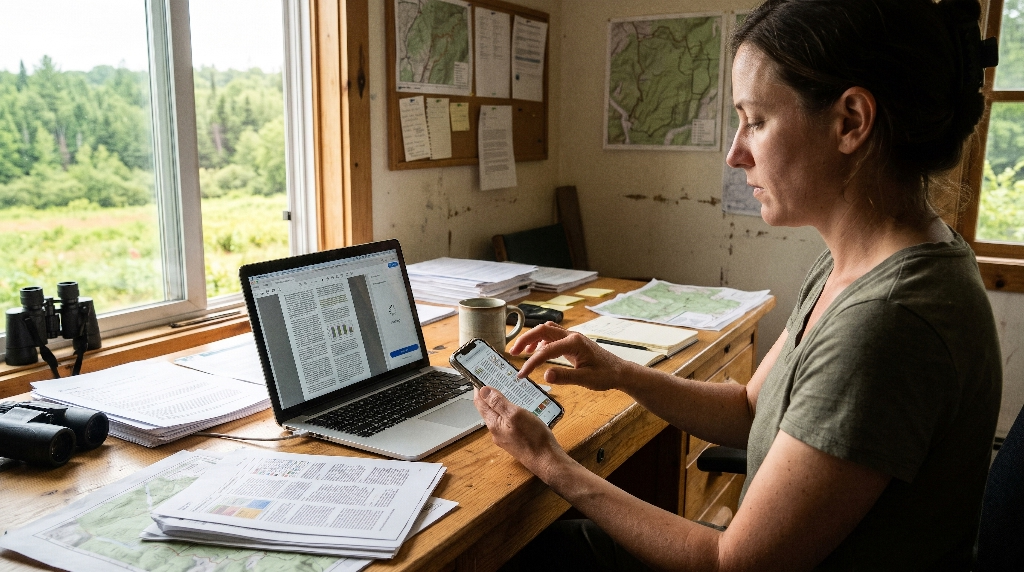
Sticking with traditional PDF downloads might feel safe and familiar, especially when your board expects a layout that looks like a printed booklet. However, clinging to static files carries steep hidden costs that quietly drain your budget and weaken your donor relationships. Before you start assembling your next annual update, it helps to examine how outdated file formats hold back your approach to visualizing your impact.
Mobile Friction and Reader Abandonment
More than half of all emails and web pages are now opened on smartphones. When a donor taps a link to a PDF stewardship report from their phone during a morning coffee break, they hit an immediate wall of friction. Standard PDF layouts are designed for wide sheets of paper, not narrow phone screens. Readers are forced to pinch, zoom, and drag their fingers sideways just to read a single paragraph about a newly protected family farm.
That clunky experience triggers rapid reader abandonment. People do not wrestle with broken formatting on their phones; they simply hit the back button and move on with their day. If your supporters cannot easily read your stories on a mobile screen, your strategy for visualizing your impact fails before a single donor reaches your fundraising appeal. Interactive web pages solve this problem automatically by stacking text, photos, and maps cleanly on any screen size.
Invisible Impact Data and Zero SEO Value
Land conservancies sit on goldmines of regional ecological data, local history, and community conservation stories. Unfortunately, when you lock that information inside a downloadable PDF, search engines like Google struggle to index and rank it properly. Even when search engines scan a PDF file, those documents rarely rank well for local searches compared to fast, well-structured web pages.
This lack of search visibility costs your land trust valuable organic traffic. Imagine a local landowner searching online for information about conservation easements in your county, or a regional foundation researching watershed restoration projects. If your best data is hidden inside a PDF attachment, those high-value visitors will never find you. Moving to an interactive web format unlocks your content so search engines can index every project, species count, and acreage milestone, making visualizing your impact a magnet for new supporters.
Blind Spots in Donor Analytics
When you publish a static PDF, your analytics dashboard leaves you flying blind. At best, your website might tell you how many times the file was downloaded. It cannot tell you if visitors actually opened the file after saving it, how many pages they read, or which conservation projects captured their imagination. You have no way of knowing whether readers skipped straight past your financial pie charts or spent five minutes studying your new trail network.
These blind spots hurt your development team. Without behavioral data, gift officers cannot see which ecological initiatives resonate most with supporters. Switching to web-based storytelling removes that guesswork. Modern web analytics show you which sections earn the longest reading times, which interactive maps get clicked the most, and where readers drop off, turning visualizing your impact into actionable donor intelligence.
High Production Overhead
Every year, land trust communications staff go through the same expensive production cycle. You hire a graphic designer to manually flow text, crop photos, and tweak margins inside desktop publishing software. If a board member catches a typo in a donor name or an updated acreage number after the layout is finished, fixing it requires re-exporting the entire document, compressing the file again, and replacing broken links across your website.
Over a five-year span, paying for rigid print-style layouts from scratch every autumn consumes thousands of dollars that could go toward land stewardship. Interactive web experiences replace that disposable workflow with reusable digital architecture. Once you build a clean, modular web report template, your team can update numbers, swap in fresh field photography, and publish new project highlights in a fraction of the time.
Why Biophilic Web Design Changes How Donors Experience Conservation Data
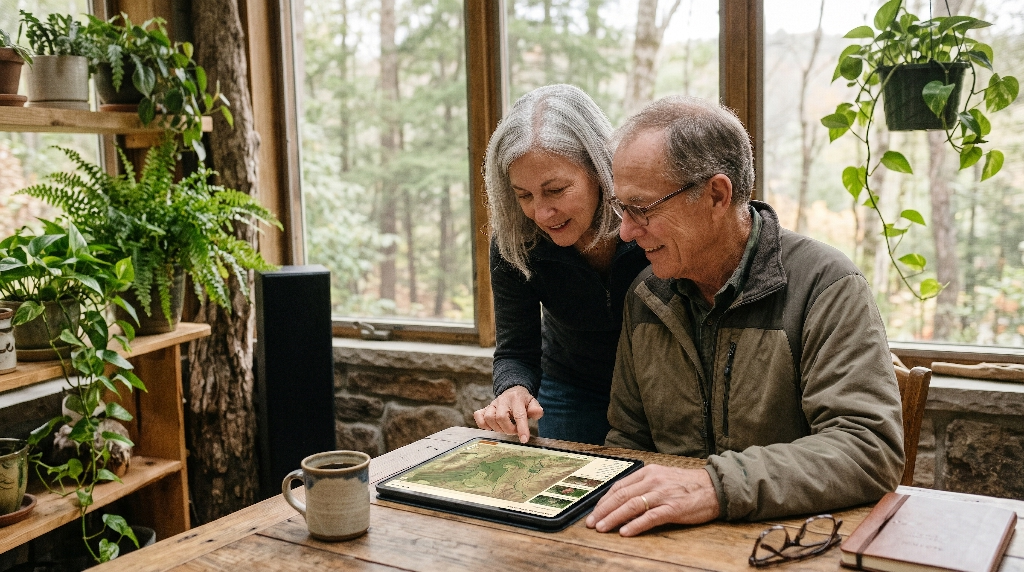
Biophilic design is the practice of bringing natural patterns, textures, and spatial rhythms into built environments so human beings feel calm, focused, and connected to nature. While architects have used biophilic principles in buildings for decades, applying them to digital spaces transforms how supporters experience your mission. When you pair biophilic web design with visualizing your impact, your website stops feeling like a corporate brochure and starts feeling like an extension of the land itself.
Applying Nature’s Patterns to Digital Interfaces
In nature, patterns are rarely rigid grids of identical boxes. Instead, natural systems use organic hierarchy, branching structures, and varied pacing. Standard nonprofit reports often overwhelm readers with dense walls of text and cluttered spreadsheets that trigger mental fatigue. Biophilic web interfaces organize information the way a healthy forest organizes light and space.
By using generous open whitespace, clear visual pathways, and natural proportions, an interactive web report guides the reader’s eye gently from big-picture milestones down to specific field details. Supporters absorb complex conservation metrics without feeling overwhelmed. This natural flow makes visualizing your impact effortless and enjoyable, keeping readers engaged from the opening headline to the final call to action.
Prospect and Refuge in UX Architecture
One of the core principles of biophilic design is the balance between prospect and refuge. In the physical world, humans feel safest and most curious when they stand in a sheltered spot with a clear, sweeping view of the landscape ahead. Great user experience architecture recreates this exact feeling on a screen.
In an interactive stewardship report, expansive full-width photography and sweeping watershed maps provide prospect, giving donors a thrilling panoramic view of the landscapes their gifts protect. Clean, focused data callouts, quiet reading zones, and clear donation buttons provide refuge, offering safe, simple moments to reflect and take action. Balancing prospect and refuge builds deep psychological trust with major gift prospects while visualizing your impact with clarity and grace.
Sensory and Emotional Resonance
People rarely give major gifts to a land trust because of a spreadsheet row; they give because they love a specific creek, meadow, ridge, or forest. Static PDFs strip away the sensory magic of the outdoors, leaving supporters with flat numbers that feel distant and cold. Interactive web design restores that emotional connection through thoughtful sensory cues.
Earthy color palettes drawn from local soil, lichen, bark, and water replace harsh corporate blues and grays. Subtle organic textures, smooth scroll transitions, and gentle motion mimic the peaceful rhythm of walking along a well-maintained trail. When your digital experience evokes the sights and feelings of the outdoors, visualizing your impact becomes an emotional journey that reminds donors why your land trust matters to their community.
The Main Technical Features of an Interactive Stewardship Report
Moving beyond static documents opens up a toolkit of interactive features that bring conservation science to life. Instead of asking supporters to take your word for it, an interactive report invites them to explore the evidence themselves. Here are four technical features that elevate visualizing your impact for modern land conservancies.
Interactive GIS Parcel and Watershed Maps
Land trusts already rely on geographic information systems to plan easements, track habitats, and monitor boundaries. Yet in a PDF report, all that rich spatial data gets flattened into a tiny, blurry map image where readers cannot even read the road names. An interactive web report connects your conservation story directly to lightweight, mobile-friendly web maps.
Supporters can zoom in on their own neighborhoods, toggle map layers on and off, and click on newly protected parcels to read stories about the families who conserved them. Readers can trace how separate preserves link together to form continuous wildlife corridors or protect downstream drinking water. Allowing donors to explore the geography firsthand turns visualizing your impact into a personal discovery experience.
Scrollytelling Restoration Timelines
Ecological restoration takes patience, science, and years of steady stewardship. A single static photograph rarely captures the transformation of an eroded farm field into a thriving native tallgrass prairie. Scrollytelling solves this challenge by linking visual changes directly to the reader’s scroll bar.
As a supporter scrolls down the page, an interactive slider or smooth crossfade transitions between historical aerial photos and recent field images. Text callouts appear alongside the visuals to explain how your crew removed invasive shrubs, seeded native wildflowers, and welcomed back pollinating insects. Watching a degraded stream bank heal right before their eyes makes visualizing your impact unforgettable for both individual donors and foundation reviewers.
Dynamic Impact Counters and Data Visualizations
Key metrics like total acres conserved, miles of public trails opened, and metric tons of carbon stored deserve to stand out. In a static document, numbers sit passively on the page. In an interactive web report, dynamic impact counters animate smoothly as the reader scrolls into view, drawing immediate attention to your annual achievements.
Interactive charts also allow users to hover or tap on data points to see deeper context. A donor can click on a bar chart showing annual stewardship hours to see how volunteer work breaks down across trail maintenance, native seed collection, and water quality testing. Clean, responsive data visualizations keep the page uncluttered while letting detail-oriented readers dig deeper while visualizing your impact.
Embedded Field Media
A static PDF is completely silent and motionless, missing out on the rich sights and sounds of the ecosystems you protect. Interactive web pages allow you to weave lightweight multimedia directly into your project stories without slowing down the browsing experience.
Imagine reading a short profile about a newly restored wetland while clicking a simple play button to hear the spring chorus of native frogs and migrating songbirds recorded on site. Or picture a 30-second vertical video clip where your stewardship director stands beside a newly installed osprey nesting platform to thank supporters directly. Integrating authentic field media adds human warmth and biological proof to your strategy for visualizing your impact.
Turning Passive Readers into Major Gift Donors and Grant Funders
An interactive stewardship report is far more than a pretty digital showcase; it is a strategic revenue engine. When designed with clear conversion pathways, your annual report actively supports your fundraising team twelve months a year. Here is how modern web architecture turns passive browsers into committed financial partners while visualizing your impact.
Actionable Engagement Analytics for Development Teams
When your report lives on your website, every scroll, map click, and video play generates helpful insight into supporter interests. By tracking how visitors interact with specific project sections, your development team learns what truly motivates your community.
If analytics show that your clean water initiative drew three times more reading time than any other section, your fundraising team knows to feature watershed protection in your upcoming spring appeal. Even better, when major donors share feedback about a specific interactive map layer they explored, gift officers gain natural, informed conversation starters. Data-driven insights take the guesswork out of visualizing your impact and sharpen your entire fundraising strategy.
Contextual Micro-Conversions
In most PDF stewardship reports, the donation request is buried on the very last page, isolated from the stories that actually move people to give. By the time a reader reaches that final page, the emotional spark has faded. Interactive web experiences replace that outdated layout with contextual micro-conversions placed right inside your project stories.
When a supporter finishes reading about a new accessible boardwalk at a popular nature preserve, a clean, inviting button right below the story invites them to fund a square foot of trail maintenance. Below a profile on youth environmental education, another prompt invites readers to sponsor a school field trip. Matching specific giving opportunities to the exact moment of inspiration dramatically increases conversion rates while visualizing your impact.
Interactive Donor and Landowner Recognition
Listing hundreds of donor names in tiny, six-point type across four crowded pages is one of the least engaging parts of a traditional annual report. Nobody enjoys squinting at a wall of text just to verify that their name was spelled correctly. Interactive web reports transform supporter recognition into an engaging community feature.
A searchable, filterable honor roll lets donors type their name to jump straight to their listing or filter supporters by giving circle, legacy society membership, or volunteer milestones. You can also highlight conservation easement landowners with optional short quotes explaining why they chose to protect their family land forever. Celebrating your community thoughtfully reinforces donor loyalty and strengthens your approach to visualizing your impact.
Frictionless Sharing for Institutional Grantmakers
Foundation program officers and government grant reviewers are busy professionals who review dozens of proposals every week. Asking a grantmaker to download a massive PDF and hunt through forty pages to verify your track record creates unnecessary friction.
An interactive web report lets you send program officers a direct link that jumps straight to the exact project, watershed map, or financial breakdown relevant to their grant guidelines. Program officers can easily share that clean URL with their board members during funding meetings with a single click. Making your results effortless to verify builds institutional credibility and positions visualizing your impact as a competitive advantage during grant cycles.
Accessibility, Performance, and Long-Term Maintainability
Many land trust leaders worry that building an interactive web experience will create technical headaches, exclude visitors with disabilities, or overwhelm a small staff. In reality, a well-engineered web report is far easier to make accessible, faster to load, and simpler to maintain than a heavy PDF file.
WCAG Compliance Out of the Box
Making a complex, multi-column PDF fully accessible for blind or low-vision readers using screen readers requires specialized remediation software and hours of tedious manual tagging. As a result, most nonprofit PDF reports fail basic Web Content Accessibility Guidelines, shutting out community members who rely on assistive technology.
Interactive web pages built with clean semantic HTML are naturally accessible from day one. Screen readers navigate headings, alt text, data tables, and buttons smoothly without getting trapped in broken reading orders. High color contrast, scalable fonts, and keyboard-friendly navigation ensure that every member of your community can participate in visualizing your impact without barriers.
Speed on Rural Cellular Connections
Land conservancies often serve rural communities where high-speed fiber internet is scarce and supporters browse on cellular networks with weak signals. A 35-megabyte PDF can take minutes to download on a rural connection, burning through mobile data plans and frustrating users before the cover page even opens.
Modern interactive web experiences are engineered for speed even in low-bandwidth environments. By compressing photographs into modern formats like WebP and AVIF, lazy-loading interactive maps only when a user scrolls down to them, and keeping code lightweight, an entire web report can load its initial view in under two seconds. Fast load times guarantee that rural landowners and trail visitors enjoy seamless performance when visualizing your impact.
Modular WordPress Workflows for Lean Staff
Most land trusts operate with lean teams where one communications coordinator wears five different hats. You do not have time to write custom computer code every autumn just to update your annual report. That is why building your interactive stewardship report inside a modular WordPress block system makes practical sense.
With custom-built biophilic blocks, updating your report next year works just like editing a simple document. Your staff can duplicate last year’s report layout, type in the new acreage totals, upload fresh field photos, and publish the updated page in a single afternoon. A modular workflow protects your team from burnout while keeping visualizing your impact fresh, accurate, and sustainable year after year.
Step-by-Step Transition Plan: Moving from Print-First PDFs to a Living Digital Report
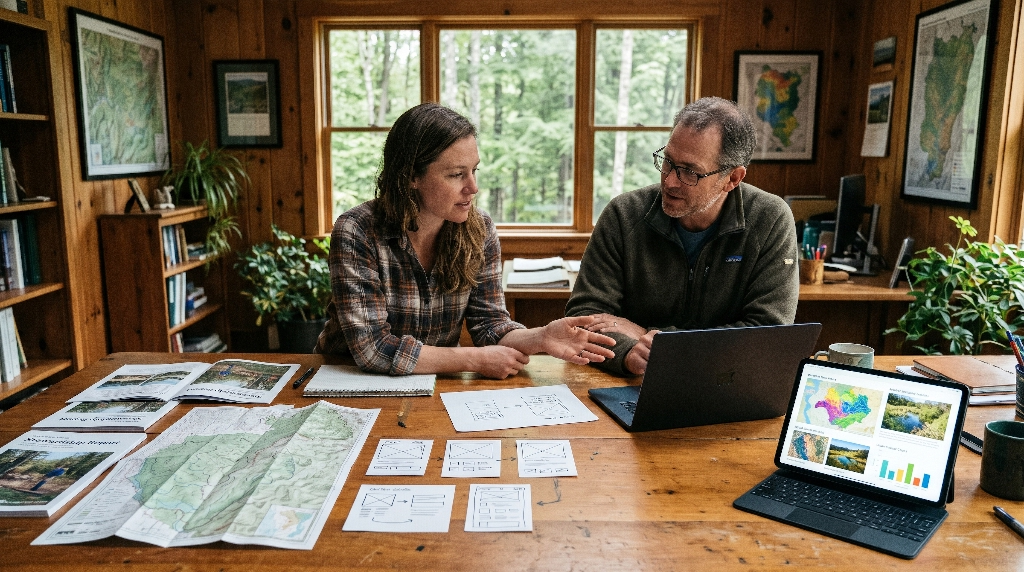
Transitioning away from traditional PDFs does not mean throwing away your hard-earned reporting traditions. By following a clear, structured roadmap, your land trust can smoothly upgrade to an interactive web experience before your next reporting cycle.
Step 1: Audit Existing PDF Assets and Data Silos
Begin by gathering your last two annual reports alongside your current GIS maps, donor spreadsheets, and photo archives. Review every page of your old PDF and ask a simple question: which parts did donors actually care about, and which parts were just filler?
Identify your strongest stories, clearest impact metrics, and best spatial maps that deserve interactive treatment. At the same time, look for ways to trim bloated text blocks and redundant tables. Auditing your assets early clarifies your scope and ensures that visualizing your impact focuses on the conservation wins that matter most.
Step 2: Map User Journeys for Key Personas
Different supporters visit your stewardship report with completely different questions in mind. Before designing a single page element, map out clear paths for your four core audiences:
- Major Donors: Want proof of long-term ecological outcomes, financial accountability, and meaningful ways to deepen their legacy.
- Local Landowners: Want to understand how conservation easements work, see nearby protected properties, and feel confident in your stewardship integrity.
- Municipal and Community Partners: Want clear data on public trail access, flood mitigation, and local economic benefits.
- Institutional Grantmakers: Want verified metrics, clear geographic boundaries, and evidence of strong organizational capacity.
Designing clear navigation paths for each group ensures that every visitor finds what they need quickly while visualizing your impact.
Step 3: Design and Prototype Biophilic Components
Once your content structure and user journeys are mapped out, translate them into interactive wireframes rooted in biophilic design. Work with designers who understand both ecology and user experience so your visual components feel authentic to your region.
Build prototypes for your interactive parcel map, scrollytelling restoration timeline, and dynamic impact counters. Test these prototypes on actual smartphones and tablets to verify that buttons are easy to tap, maps are smooth to pan, and text remains crisp in bright outdoor sunlight. Thoughtful prototyping eliminates guesswork and sets a high bar for visualizing your impact.
Step 4: Launch with a Multi-Channel Rollout
When your interactive stewardship report goes live, treat it as a flagship campaign rather than a quiet website update. Break your report into bite-sized pieces for a coordinated multi-channel rollout:
- Send a series of three short emails highlighting different interactive features, such as your new watershed map or a dramatic habitat restoration slider.
- Share short screen recordings and field photos on social media linking directly to specific project sections.
- Mail a concise, high-impact one-page printed postcard to your mailing list featuring a clean QR code that opens the interactive report directly on their phone.
A multi-channel launch maximizes traffic, stretches your marketing budget, and gets the whole community excited about visualizing your impact.
Frequently Asked Questions About Digital Stewardship Reports
Switching to a digital-first stewardship model naturally raises practical questions from executive directors, development staff, and board members. Here are clear answers to the three most common concerns land trusts raise before making the leap.
What About Older Donors Who Still Prefer a Physical Copy in the Mail?
You never have to leave loyal offline supporters behind. A well-built interactive web report includes a dedicated print stylesheet that automatically formats your key stories, impact numbers, and financial summary into a clean, readable layout whenever someone clicks print. Even better, many land trusts pair their full interactive web hub with a compact, four-page printed executive summary mailed to major donors and board members. That printed mailer satisfies supporters who love holding paper in their hands while inviting them to explore deeper maps and field videos online, giving everyone the best of both worlds for visualizing your impact.
How Does the Cost of an Interactive Web Report Compare to Designing and Printing a Traditional Report?
In the first year, building a custom interactive stewardship report typically costs roughly the same as designing, printing, and mailing a high-end traditional booklet. The real financial advantage shows up in years two, three, and beyond. Because you own a reusable digital framework rather than a one-time print file, you eliminate recurring printing bills, rising postage rates, and expensive layout rebuilds every autumn. Over a three-year horizon, most land conservancies save thousands of dollars while seeing higher donor engagement and stronger online giving from visualizing your impact.
Can We Protect Sensitive Location Data for Rare Species or Private Conservation Easements on an Interactive Map?
Yes, protecting landowner privacy and sensitive ecological data is straightforward with modern web mapping tools. You never need to display exact property street addresses or pinpoint the nesting sites of endangered species. Instead, interactive conservation maps use generalized polygon boundaries, watershed-level clustering, or public preserve overlays to showcase regional connectivity while keeping private easements and vulnerable habitats completely secure. Your GIS team retains full control over which data layers appear publicly, allowing you to share compelling landscape stories safely while visualizing your impact.
Partnering with Silphium Design to Visualize Your Conservation Impact
Your land trust works tirelessly to protect irreplaceable forests, wetlands, farms, and watersheds. Your annual stewardship report should reflect the same vitality, integrity, and care that your team brings to the land every day. Leaving static PDF graveyards behind allows you to tell richer ecological stories, connect deeply with mobile readers, and turn annual reporting into a year-round engine for major gifts and grants.
The Silphium Design Advantage
At Silphium Design, we bridge the gap between conservation biology and modern web engineering. Unlike generic marketing agencies that treat land trusts like standard retail businesses, we understand watershed ecology, native plant restoration, GIS spatial data, and the unique trust required to earn conservation easements. We craft custom, high-performing biophilic web experiences that honor your mission, load rapidly on rural connections, and make visualizing your impact effortless for your staff and unforgettable for your donors.
Schedule Your Stewardship Report Audit
If your organization is ready to replace outdated PDF downloads with an interactive web experience that attracts landowners, engages grantmakers, and inspires donors, we would love to help.
today to explore our conservation web design work and schedule a complimentary Stewardship Report Audit. Together, we will review your current annual report, identify high-impact interactive opportunities, and map out a living digital habitat that brings your conservation achievements to life.