
Table of Contents
When developers build websites for native plant nurseries, eco-friendly landscape architects, or environmental organizations, they often rely on simple tools. The most common tool is a map of USDA Hardiness Zones. However, relying solely on USDA Hardiness Zones creates major flaws in information architecture, user experience, and search engine optimization.
In this article, we will examine why USDA Hardiness Zones are not enough on their own. We will see how combining USDA Hardiness Zones with Environmental Protection Agency (EPA) Ecoregions creates a far better website taxonomy, in addition to giving a clearer picture of the geographic situation. This shift improves faceted search, builds strong search engine entities, and creates a true biophilic web experience.
The Biological and Digital Architecture Gap
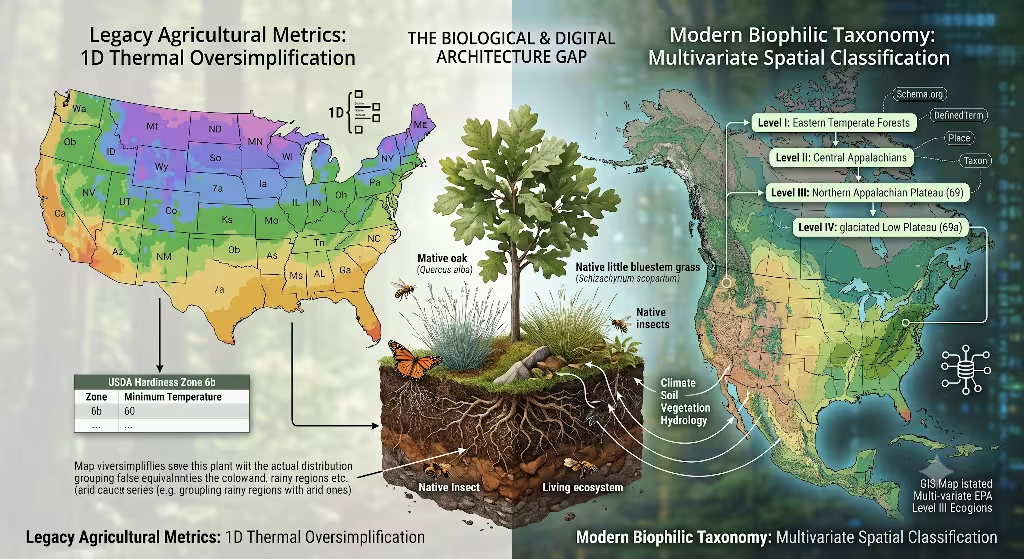
Web design should reflect the natural world when building sites about plants and nature. For decades, traditional web developers have used USDA Hardiness Zones as the primary way to organize plant catalogs. This approach creates a huge biological and digital gap.
+-----------------------------------------------------------------------+
|                       THE TAXONOMY MISMATCH                           |
+-----------------------------------------------------------------------+
|  USDA Hardiness Zones (1D Metric)     EPA Ecoregions (Multi-D Graph)  |
|  - Measures ONLY coldest winter temp  - Measures climate, soil, water |
|  - Groups rainforests with deserts    - Maps true native ecosystems   |
|  - Flat filter for plant survival     - Rich hierarchy for web UX     |
+-----------------------------------------------------------------------+
The Main Thesis
Legacy web taxonomies rely on one-dimensional agricultural metrics like USDA Hardiness Zones. This reliance fails to capture real ecological relationships. Plants do not grow based on winter cold alone. They depend on complex relationships with soil, rainfall, elevation, light, and local insects.
Modern biophilic websites need multi-variate spatial classification systems like EPA Ecoregions. Using EPA Ecoregions alongside USDA Hardiness Zones lets web architects build accurate search engine entities. It improves faceted filtering for e-commerce. It also provides a contextually grounded user experience that reflects how plants actually grow in nature.
The Scientific Disconnect
Why are USDA Hardiness Zones scientifically limited for web taxonomies? The answer lies in how the data is collected. USDA Hardiness Zones measure only a single variable. That variable is the thirty year average annual extreme minimum temperature.
USDA Hardiness Zones divide the country into ten degree Fahrenheit bands, which are split into five degree sub-zones. While USDA Hardiness Zones tell you if a plant might freeze to death in winter, USDA Hardiness Zones tell you nothing else.
USDA Hardiness Zones do not measure annual rainfall. USDA Hardiness Zones do not account for summer heat or humidity. The zones ignore soil pH, soil texture, drainage, elevation, and mountain shade. They do not consider whether the pollinator for the plant is present.
When web architecture relies exclusively on USDA Hardiness Zones, it oversimplifies complex ecological datasets. A web catalog using only hardiness treats a soggy swamp in Florida as identical to a dry mountain in Arizona if they happen to share the same average cold night in January.
The SEO and Information Architecture Problem
Using single-variable filtering based only on USDA Hardiness Zones creates serious problems for search engine optimization and site structure.
First, organizing pages around USDA Hardiness Zones limits programmatic internal linking. When your site only connects pages by hardiness zone, you miss opportunities to connect plants that naturally grow together in ecosystems. Search engines look for semantic relationships between items. A taxonomy built only on USDA Hardiness Zones gives search engine crawlers weak topic signals.
Second, using only hardiness zones distorts local search intent. A homeowner searching for native plants in their town does not want plants that merely survive the winter. They want plants that thrive in their local soil and climate. If they are planting a butterfly/pollinator garden, they want to know that a particular plant species will help the targeted insect. Pages organized purely by hardiness zones fail to meet this intent.
Third, native plant databases and e-commerce stores suffer from poor semantic coverage when they rely on USDA Hardiness Zones alone. Users search for terms like woodland garden plants or coastal plain shrubs. A site categorized only by hardiness zones cannot serve these long-tail queries effectively. By upgrading from hardiness zones to a modern spatial taxonomy, we solve these underlying issues.
Comparative Technical Matrix: Data Granularity and IA Suitability
To understand why web taxonomies must move beyond hardiness zones, we need to compare the technical attributes of USDA Hardiness Zones directly against EPA Level I through IV Ecoregions.
+-------------------------------------------------------------------+
|               TAXONOMY DATA STRUCTURE COMPARISON                  |
+-------------------------------------------------------------------+
|  FEATURE             | USDA HARDINESS ZONES | EPA ECOREGIONS      |
+----------------------+----------------------+---------------------+
|  Primary Variable    | Extreme Cold Temp    | Multi-Factor Ecosystem|
|  Data Type           | Scalar / Ordinal     | Vector Shapefile    |
|  Hierarchy Levels    | Single Tier (1-13)   | 4 Nested Levels     |
|  Native Plant Fit    | Low                  | High                |
|  Local SEO Power     | Basic                | Advanced Entity     |
+-------------------------------------------------------------------+
USDA Hardiness Zones answer a simple question: Will this plant freeze in winter? EPA Ecoregions answer a complete ecological question: Will this plant thrive in this environment? Web information architecture must evolve from simple thermal filtering with hardiness zones to rich, systemic spatial classification.
| Evaluation Metric | USDA Hardiness Zones | EPA Level I–IV Ecoregions | Web Taxonomy Impact |
| Primary Variable | Minimum annual winter temperature in 5 or 10 degree steps. | Integrated ecological variables including geology, climate, soil, hydrology, and native vegetation. | USDA Hardiness Zones provide flat, single-axis arrays. EPA Ecoregions offer multi-dimensional relational graphs. |
| Spatial Scale | Macro-thermal bands drawn across broad geographic regions. | Four nested levels ranging from Level I (12 broad regions) to Level IV (967 detailed sub-regions). | EPA Ecoregions map cleanly into clear nested URL paths, unlike flat lists of USDA Hardiness Zones. |
| Data Type | Scalar numbers (Zone 1 to Zone 13, with a and b sub-zones). | Spatial vector polygons and rich categorical entities. | EPA Ecoregions support GIS queries, PostGIS databases, and interactive maps better than USDA Hardiness Zones. |
| Native Plant Accuracy | Low. Places very different ecosystems into identical buckets based on cold alone. | High. Isolates natural plant ranges and co-adapted wildlife communities. | Prevents false plant recommendations in e-commerce site search filters compared to USDA Hardiness Zones. |
| Local SEO Entity Value | Moderate. Useful for basic regional targeting in general gardening. | Exceptional. Matches geographic entities in Google Knowledge Graphs and Schema metadata. | Builds deeper topical authority and captures long-tail ecological search traffic better than USDA Hardiness Zones. |
Analyzing the Technical Differences
When we look at USDA Hardiness Zones from a database perspective, hardiness zones function as flat string tags or simple integers. You can tag a plant with USDA Hardiness Zones like Zone 6a or Zone 7b. But that integer carries no extra spatial data.
In contrast, EPA Ecoregions exist as hierarchical spatial data. Level I divides North America into broad ecological areas like Eastern Temperate Forests or North American Deserts. Level II zooms in further. Level III provides regional detail like the Blue Ridge or the Ridge and Valley. Level IV provides fine-grained local detail.
For web developers, this nested structure fits naturally into modern web navigation. While USDA Hardiness Zones only allow flat filtering, EPA Ecoregions support drill-down navigation, breadcrumb paths, and dynamic landing pages.
Frequently Asked Questions about USDA Hardiness Zones and EPA Ecoregions
When users search for information about plant hardiness and regional planting, they ask specific questions. Below, we address the top search queries found in Google search results, comparing USDA Hardiness Zones with ecoregional classification.
What is the fundamental difference between USDA Hardiness Zones and EPA Ecoregions?
The fundamental difference lies in single-variable temperature thresholds versus holistic ecosystem mapping. USDA Hardiness Zones were created by the United States Department of Agriculture primarily for agricultural crops, non-native plants, and farm management. USDA Hardiness Zones measure only one factor: how cold an area gets on average during its coldest winter night over a thirty year period.
EPA Ecoregions were developed by environmental scientists to map entire living ecosystems. Instead of looking at cold temperatures alone, EPA Ecoregions analyze a combination of environmental factors:
- Underlying rock types and geology
- Soil texture, depth, and moisture levels
- Total annual precipitation and seasonal rainfall patterns
- Elevation, slope, and terrain shape
- Native animal, insect, and plant communities
From a web taxonomy perspective, USDA Hardiness Zones behave like flat product tags. EPA Ecoregions behave like a relational database tree. USDA Hardiness Zones tell a user if a plant can survive a frost. EPA Ecoregions tell a user if a plant belongs in that specific natural habitat.
Why are USDA Hardiness Zones insufficient for native plant and biophilic web taxonomies?
To understand why USDA Hardiness Zones fall short, consider the false equivalency paradox. Under the system of USDA Hardiness Zones, Seattle, Washington and parts of coastal Georgia sit in similar thermal bands. Both areas fall into warm USDA Hardiness Zones.
However, Seattle experiences cool, damp winters and dry summers with oceanic soils. Georgia experiences hot, humid summers, heavy rain, and red clay soils. If an e-commerce website relies only on hardiness zones for its search filters, it will tell a user in Seattle that a Georgia wetland plant is perfect for their garden.
+-----------------------------------------------------------------------+
|                    THE FALSE EQUIVALENCY PARADOX                      |
+-----------------------------------------------------------------------+
|  Location A: Seattle, WA             |  Location B: Coastal Georgia   |
|  - Cool damp winters                 |  - Mild winter nights          |
|  - Dry summer season                 |  - Hot humid summers           |
|  - Glacial gravelly soils            |  - Heavy rain & red clay soils |
+--------------------------------------+--------------------------------+
|  RESULT UNDER USDA HARDINESS ZONES: Treated as identical zones!       |
|  RESULT UNDER EPA ECOREGIONS: Properly split into distinct regions!   |
+-----------------------------------------------------------------------+
When web users buy plants based solely on USDA Hardiness Zones, those plants often die because the soil or moisture is wrong. This leads to high product return rates, negative user reviews, and lost trust. A website taxonomy built only on USDA Hardiness Zones fails to provide the accuracy that modern biophilic web design requires.
How do EPA Ecoregions improve website faceted search and programmatic SEO?
Faceted search allows users to narrow down large plant catalogs using multiple filters. When you replace or augment USDA Hardiness Zones with EPA Ecoregions, your faceted search becomes vastly more powerful.
Instead of selecting from a flat dropdown of USDA Hardiness Zones, users can filter by broad region, sub-region, and specific habitat. For example, a user can start at Eastern Temperate Forests, filter down to Piedmont, and select dry upland soils.
For programmatic SEO, EPA Ecoregions allow you to generate targeted landing pages that match long-tail search queries. Instead of competing for broad keywords like plants for Zone 6, which is overcrowded due to generic USDA Hardiness Zones content, you can rank for targeted terms like native shade plants for Piedmont clay soils.
These ecoregional landing pages match high-intent searches. Search engines recognize that your site provides deep, specific content rather than generic lists based on USDA Hardiness Zones. This builds topical authority across your entire domain.
Can you convert ZIP codes to EPA Ecoregions for dynamic location-based UX?
Yes, you can convert ZIP codes to EPA Ecoregions, and doing so creates an exceptional user experience. While users often know their ZIP code, they rarely know their EPA Ecoregion, though they might know their general zone from USDA Hardiness Zones.
To implement this on a website:
- The user enters their 5-digit USPS ZIP code into a search box.
- The web application checks a backend spatial database using PostGIS or a GIS lookup table.
- The spatial engine converts the ZIP code centroid into geographic coordinates.
- The system performs a spatial point-in-polygon query against the EPA Ecoregion shapefile boundaries.
- The system identifies both the user’s USDA Hardiness Zones and their exact EPA Level III and Level IV Ecoregions.
Once the system identifies the user’s ecoregion, the website UI can dynamically update. The site can surface relevant native species, display custom planting schedules, and adjust visual themes to match the user’s local landscape. This creates a personalized experience far beyond what static USDA Hardiness Zones can offer.
Designing the URL Architecture and Schema.org Metadata Schema
A strong taxonomy requires a clean URL structure and structured data. Let’s look at how to build an information architecture that elevates EPA Ecoregions while maintaining compatibility with USDA Hardiness Zones.
URL Hierarchy Comparison
Legacy websites built around USDA Hardiness Zones often use shallow, flat URL paths that mix unrelated plants together:
[domain.com/plants/zone-6b/perennials/](https://domain.com/plants/zone-6b/perennials/)
This legacy structure groups plants from completely different ecosystems together simply because they share hardiness zones.
A modern biophilic URL architecture uses hierarchical ecoregional paths. This approach creates logical directories that search engine crawlers can follow easily:
[domain.com/ecoregions/eastern-temperate-forests/marine-west-coast-forest/willamette-valley/](https://domain.com/ecoregions/eastern-temperate-forests/marine-west-coast-forest/willamette-valley/)
Notice how this URL moves naturally from macro-region down to micro-region. For product pages, you can maintain clean canonical links while placing plants in their native ecoregional contexts:
[domain.com/plants/native/acer-saccharum/](https://domain.com/plants/native/acer-saccharum/)
You can then link to this product page from both ecoregion category pages and secondary attribute pages based on USDA Hardiness Zones.
+-----------------------------------------------------------------------+
|                     OPTIMAL TAXONOMY LINK FLOW                        |
+-----------------------------------------------------------------------+
|                     [ Level I Ecoregion Page ]                        |
|                                 |                                     |
|                     [ Level III Sub-Region ]                          |
|                                 |                                     |
|                      [ Native Species Page ]                          |
|                                / \                                    |
|   [ USDA Hardiness Zone 5a ] <--   --> [ Soil Type: Moist Loam ]      |
+-----------------------------------------------------------------------+
JSON-LD Structured Data Schema Implementation
To help search engines understand your site content, you should implement JSON-LD structured data. Schema.org allows us to define entities using DefinedTerm, Place, and Taxon.
Below is a complete JSON-LD example. It shows how to mark up a native plant page, linking its ecological data with both its EPA Ecoregion and its compatible USDA Hardiness Zones:
JSON
{
  "@context": "https://schema.org",
  "@graph": [
    {
      "@type": "DefinedTerm",
      "@id": "https://silphiumdesign.com/ecoregions/level-iii/59#term",
      "name": "Northeastern Highlands",
      "termCode": "EPA-L3-59",
      "inDefinedTermSet": "https://www.epa.gov/eco-research/ecoregions"
    },
    {
      "@type": "DefinedTerm",
      "@id": "https://silphiumdesign.com/zones/usda-zone-5b#term",
      "name": "USDA Plant Hardiness Zone 5b",
      "termCode": "USDA-5B",
      "inDefinedTermSet": "https://planthardiness.ars.usda.gov/"
    },
    {
      "@type": "Taxon",
      "@id": "https://silphiumdesign.com/plants/acer-saccharum#taxon",
      "name": "Acer saccharum",
      "commonName": "Sugar Maple",
      "description": "A native deciduous tree known for brilliant fall foliage and sap used for maple syrup.",
      "additionalProperty": [
        {
          "@type": "PropertyValue",
          "name": "USDA Plant Hardiness Zone Range",
          "value": "USDA Hardiness Zones 3a through 8b"
        },
        {
          "@type": "PropertyValue",
          "name": "Primary Native Ecoregion",
          "value": "EPA Level III Region 59 - Northeastern Highlands"
        },
        {
          "@type": "PropertyValue",
          "name": "Soil Moisture Need",
          "value": "Moist, well-drained soils"
        }
      ]
    }
  ]
}
By providing structured data that includes both EPA Ecoregions and USDA Hardiness Zones, you give search engine algorithms clear signals. Search engine bots can clearly see that your content covers both general cold tolerance and specific ecological habitat requirements.
Biophilic UI/UX and Spatial Design Patterns
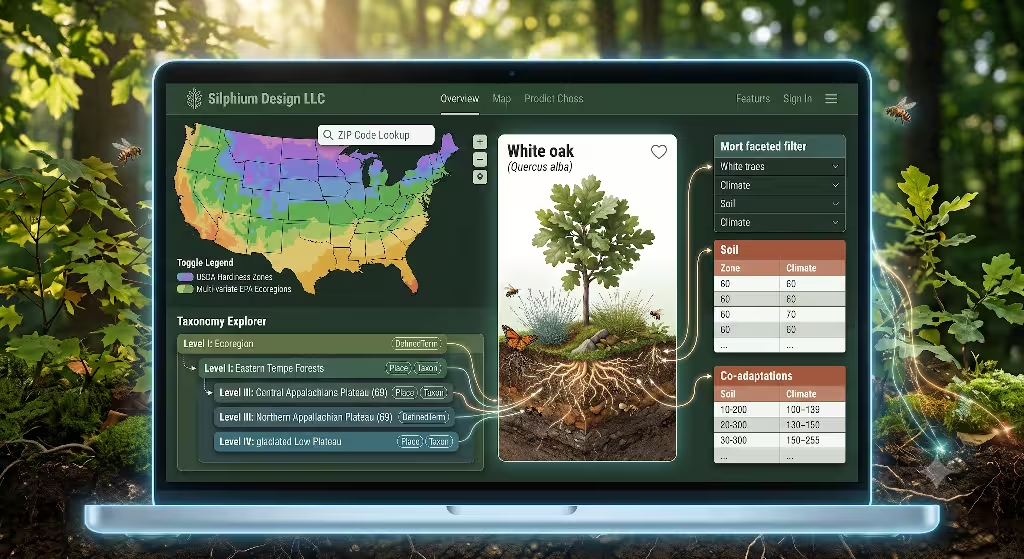
Biophilic web design is about more than just adding photos of leaves or green background colors to a webpage. True biophilic design means structuring information so that it reflects natural systems.
When designing user interfaces for plant data, we should move beyond static text lists of USDA Hardiness Zones. We can use visual spatial patterns that connect users directly with their surrounding environments.
+-----------------------------------------------------------------------+
|                    BIOPHILIC TAXONOMY ENGINE                          |
+-----------------------------------------------------------------------+
|  User Input: ZIP Code / City / Geo-Location                           |
+-----------------------------------------------------------------------+
                                   |
                                   v
+-----------------------------------------------------------------------+
|               Spatial Lookup Engine (PostGIS / GIS Data)              |
+-----------------------------------------------------------------------+
                   /                               \
                  v                                 v
+-----------------------------------+   +-------------------------------+
|  USDA Hardiness Zones Layer       |   |  EPA Ecoregions Layer         |
|  - Identifies cold safety limits  |   |  - Maps soil, water, plants   |
|  - Sets secondary plant filters   |   |  - Controls primary UI theme  |
+-----------------------------------+   +-------------------------------+
                  \                                 /
                   v                               v
+-----------------------------------------------------------------------+
|                Adaptive Biophilic UI Interface                        |
|  - Displays contextual plant palettes matched to local ecology        |
|  - Updates site CSS variables (earthy tones, regional textures)      |
|  - Shows seasonal planting alerts based on real environmental data    |
+-----------------------------------------------------------------------+
Visualizing Spatial Metadata with Interactive Maps
Instead of forcing users to select USDA Hardiness Zones from a dropdown, present them with an interactive vector map. You can build these maps using light web libraries like Leaflet or Mapbox.
The interactive map can display EPA Ecoregion boundaries as subtle polygon overlays. When a user hovers over or clicks their region, the interface highlights their local ecosystem. It can show their specific Level IV Ecoregion while displaying their corresponding USDA Hardiness Zones as a secondary readout.
This spatial interaction helps users understand that their local environment is a distinct living space, not just a cold temperature number on a map of USDA Hardiness Zones.
Dynamic Biophilic Color Palettes and Themes
An advanced biophilic UI pattern adapts the website visual design based on the selected ecoregion. Modern web development allows us to change CSS design tokens dynamically based on user context.
For example, if a user lands on a page for an arid desert ecoregion, the UI design can smoothly transition CSS variables:
- Primary accents shift to warm terracotta and sandy stone tones.
- Background textures adopt subtle patterns inspired by dry earth and granite.
- Content highlights focus on drought tolerance and water conservation features.
If the user switches to a cool temperate forest ecoregion, the UI shifts:
- Primary accents move to deep moss greens and rich leaf shades.
- Micro-interactions mirror smooth water movement or gentle breezes.
- Content highlights focus on shade tolerance and leaf canopy layers.
While traditional sites using USDA Hardiness Zones display static web pages, ecoregional biophilic sites offer responsive visual themes. These themes build a deeper emotional connection between the user and their regional environment.
Hybrid Taxonomy Strategy: Best Practices for Web Developers and SEOs
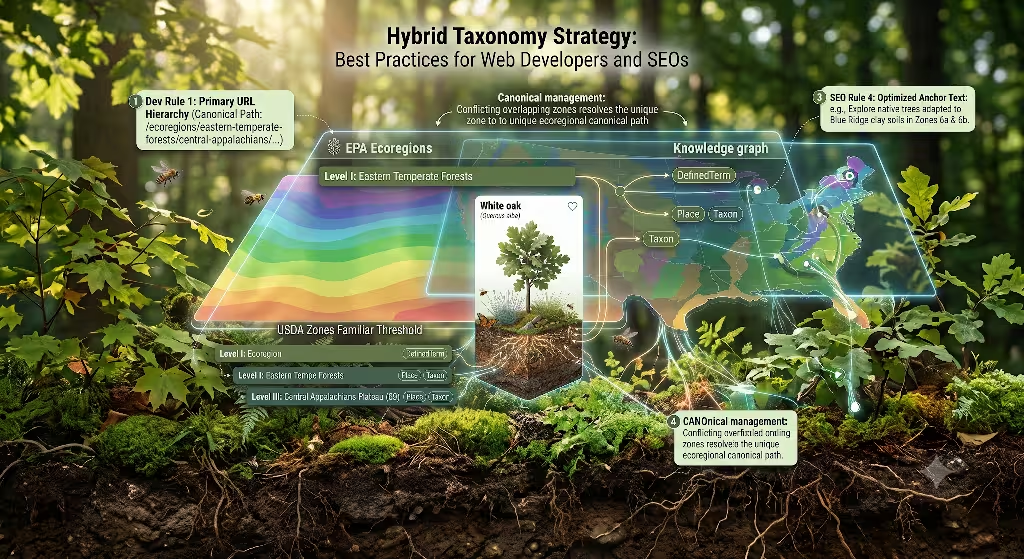
Migrating a website away from a legacy system built purely on USDA Hardiness Zones does not mean you must throw away hardiness zones entirely. Millions of gardeners and shoppers are familiar with USDA Hardiness Zones. Completely removing USDA Hardiness Zones would confuse users and disrupt established search traffic.
Instead, the best solution is a hybrid taxonomy strategy. This approach uses EPA Ecoregions as the main structural foundation while keeping hardiness zones as secondary functional attributes.
+-----------------------------------------------------------------------+
|                      HYBRID TAXONOMY STRUCTURE                        |
+-----------------------------------------------------------------------+
|  PRIMARY HIERARCHY (EPA Ecoregions):                                  |
|  --> Category: Level I Ecoregion (e.g., Eastern Temperate Forests)    |
|    --> Sub-Category: Level III Ecoregion (e.g., Blue Ridge)           |
|      --> Habitat Group: Oak-Hickory Forest Community                  |
+-----------------------------------------------------------------------+
|  SECONDARY ATTRIBUTES (Faceted Filters):                              |
|  [x] Compatible USDA Hardiness Zones (e.g., Zone 6a, Zone 6b)         |
|  [x] Light Requirement (e.g., Full Sun, Part Shade)                   |
|  [x] Soil Type (e.g., Clay, Sandy Loam)                               |
+-----------------------------------------------------------------------+
Rule 1: Use EPA Ecoregions for Primary URL Categories
Set up your primary site navigation and URL path directories around EPA Ecoregions. This approach builds a logical content structure that search engine crawlers can index easily.
Your top-level category pages should represent EPA Level I or Level II regions. Sub-categories should represent Level III or Level IV regions. This structure creates clean categorical buckets for native plant collections and ecological service guides.
Rule 2: Keep USDA Hardiness Zones as Faceted Filters
Do not delete USDA Hardiness Zones from your database. Instead, demote USDA Hardiness Zones from primary URL directories to secondary filter facets.
When a user browses a Level III Ecoregion category page, let them filter the displayed plants using a checkbox list of USDA Hardiness Zones. This gives users the familiar reassurance of checking USDA Hardiness Zones without breaking the site’s overall ecological structure.
Rule 3: Manage Programmatic SEO and Canonical Tags
When creating pages for every combination of ecoregions and USDA Hardiness Zones, manage your canonical tags carefully to avoid duplicate content issues.
- Primary Category Pages: Ecoregion pages (e.g.,
/ecoregions/blue-ridge/) should have self-referential canonical tags. - Faceted Filter URLs: URLs generated by checking specific USDA Hardiness Zones (e.g.,
/ecoregions/blue-ridge/?zone=6b) should point their canonical tags back to the main ecoregion parent page. - Dedicated High-Intent Pages: If you create specific programmatic landing pages targeting high-volume searches (e.g.,
/native-plants-zone-6b-blue-ridge/), ensure those pages feature unique, written content about cold tolerance and local soil conditions.
Rule 4: Optimize Internal Anchor Text
When linking between plant product pages and category pages, use descriptive anchor text that incorporates both ecological terms and references to USDA Hardiness Zones.
Instead of generic links like “View Zone 6 Plants,” use rich anchor text like “Explore native shrubs adapted to Blue Ridge clay soils in USDA Hardiness Zones 6a and 6b.” This practice reinforces semantic entity associations for search engine algorithms.
Final Thoughts
Organizing digital information about the natural world requires thoughtful planning. For decades, web development relies on USDA Hardiness Zones as a quick shortcut for categorizing plant life online. But as we have explored, hardiness zones measure only a single variable: extreme minimum winter cold.
+-----------------------------------------------------------------------+
|                     SUMMARY: TAXONOMY EVOLUTION                       |
+-----------------------------------------------------------------------+
|  LEGACY TAXONOMY                  |  MODERN BIOPHILIC TAXONOMY        |
|  - USDA Hardiness Zones alone     |  - EPA Ecoregions as primary hierarchy|
|  - Single-variable thermal metric |  - Multi-variate spatial graph    |
|  - Flat filtering lists           |  - USDA Hardiness Zones as filter |
|  - Weak entity signals for SEO    |  - Rich Schema.org entity graphs  |
|  - Disconnected user experience   |  - Adaptive biophilic UI themes   |
+-----------------------------------------------------------------------+
While USDA Hardiness Zones remain helpful for preventing frost damage in non-native crops, hardiness zones cannot represent true ecological relationships. Relying exclusively on USDA Hardiness Zones leads to inaccurate recommendations, weaker search engine rankings, and fragmented user experiences.
By transitioning to a hybrid information architecture, web designers can unlock the full potential of biophilic web development:
- Adopt EPA Ecoregions as your primary category hierarchy to reflect true ecosystem boundaries.
- Retain USDA Hardiness Zones as secondary filter attributes to give users familiar cold tolerance data.
- Implement Rich Schema.org Markup to connect ecoregions and USDA Hardiness Zones within search engine knowledge graphs.
- Deploy Dynamic Biophilic UI Elements that personalize design themes, maps, and plant recommendations based on local geography.
At Silphium Design LLC, we believe that websites should be as well-structured, interconnected, and vibrant as natural ecosystems. By moving beyond simple thermal minimums and integrating ecoregional spatial taxonomy alongside USDA Hardiness Zones, web architects can build digital platforms that serve search engine requirements, business goals, and the natural world.
Want to Take it a Step Further
If you want to take things up another level you can add the 12 butterfly gardening regions as presented in The Gardener’s Butterfly Book (Branhagen 2001). The regions are similar to the EPA ecoregions, but from a butterfly perspective. Using this map, you can further refine your plant selection.
References
Branhagen, Alan. 2001. The Gardener’s Butterfly Book. (Minnetoka, MN: National Home Gardening Club). 208 pp.