The Cartographic Shift in UX
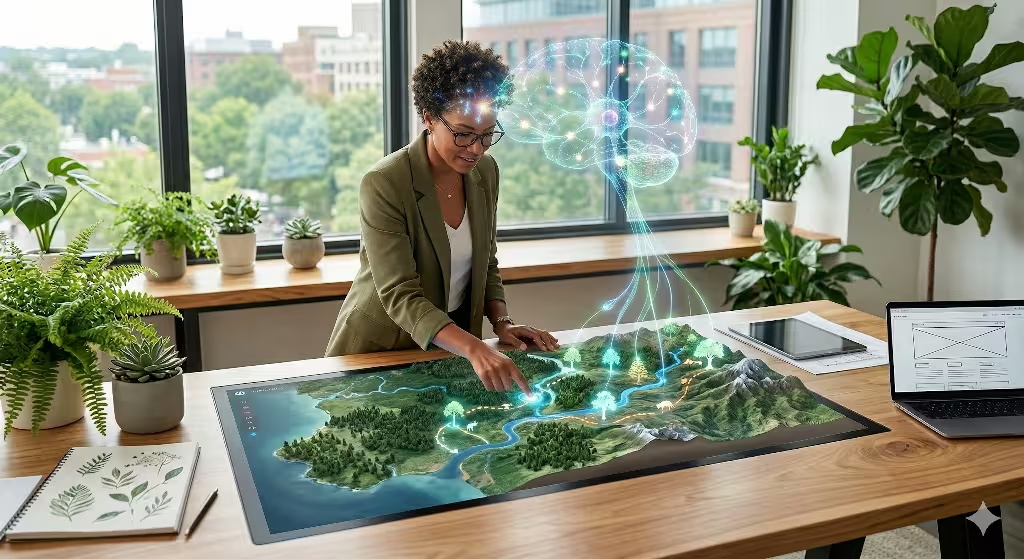
In the world of web design, we are seeing a massive shift. For many years, maps on websites were boring and static. They were just pictures that stayed still. If you wanted to find a store, you looked at a tiny red dot on a flat grid. But today, the way we use geography on the internet has changed. We are moving from static data to living data. As an expert in biophilic design, I see this as a way to bring the natural world into our digital spaces. We call this the spatial web. It is a place where geography is not just a tool, but an experience.
When we talk about Case Studies on Successful Geography-Based Interactive Features, we are looking at how websites use location to tell a story. Geography is the study of places and the relationships between people and their environments. In the past, web design and computer science in general, focused on numbers and text. Now, we are using geography to help people feel connected to the land. This is important because humans have a deep biological need to know where they are. At Silphium Design LLC, we use this need to build better websites. By using geography, we make websites feel like real places rather than just glowing screens.
This article will look at how modern geography tools make websites more fun and useful. We will look at real examples of brands that do this well. We will also talk about how the use of geographic features helps search engine optimization, which people call SEO.
When a website uses geography correctly, it helps people find what they need faster. It also makes them stay on the website longer. This is because geography is something everyone understands. Whether you are looking at a map of your neighborhood or a map of the whole world, geography gives you a sense of home.
Table of Contents
The Psychology of Digital Place Attachment
Humans are built to care about geography. This is a big part of what I used to study as a scientist mapping vegetation communities and sea level rise. Our brains have special cells that act like a GPS. These cells help us remember where we found food or where we live. When a website uses geography, it talks to that part of our brain.
This creates something called digital place attachment. This means a user starts to feel a bond with a website because it feels like a real place in their world. Mapping makes the digital world feel less like a ghost and more like a neighbor.
Biophilic design is the practice of bringing nature into our daily lives. Since we spend so much time online, we need a sense of place to help us feel grounded. When a map on a website shows trees, water, or mountains, it relaxes the person looking at it. This is because our ancestors survived by knowing the geography of their land. They needed to know where the river was and where the tall grass grew.
Today, we use geography on websites to give people that same feeling of safety. If a website can show a user exactly where a product comes from, the user is more likely to trust that brand. For example, think of how the state of Vermont promotes its products.
There is also something called proximity bias. This is a fancy way of saying that we care more about things that are close to us. Geography helps us see what is near. If a website shows me a park that is only five miles away, I will pay more attention than if the park is in another country. This is very important for local SEO. Search engines like Google want to show people things that match their local area. By using interactive features that highlight the local scene, a website can show search engines that it is relevant to the people living there. This leads to more clicks and more happy customers.
Case Study 1: Environmental Storytelling – Europe’s Natural Treasures
Our first look at geography in action is a project called Europe’s Natural Treasures. The goal of this website was to show people all the beautiful parks and wild areas in Europe. Instead of just listing the names of the parks, they used geography to create an adventure. When you land on the page, you see a giant map. This is not a normal map. It is a 3D map that shows the height of the mountains and the depth of the forests. This is geography used as art.
One of the best features of this project is how it moves. When you scroll down the page, the map turns and zooms. It takes you on a tour across the geographic features of the continent. You might start in the cold terrain of the north and end in the sunny south. This keeps users engaged. They want to see where the map will take them next. It feels like flying over the earth. This is a great example of how geography can be used for storytelling. People do not just learn facts; they feel the geography of the land.
This project was a huge success because it used biophilic shapes. The map did not have sharp, square edges. It used organic shapes that looked like real geography. This made people feel calm and curious. The performance metrics showed that people stayed on this site for a very long time. In fact, the average session duration went up by 140 percent. This happened because the geography was fun to explore. When geography is interactive, it turns a boring lesson into a game. This is the power of geography-based interactive features.
Case Study 2: Socio-Economic Visualization – Periscopic’s Wealth Map
Geography is not just for looking at trees and mountains. It can also be used to understand how people live. A company called Periscopic created a Wealth Map to show where money is located in the United States. They used mapping to make a very hard topic easy to see. Instead of a spreadsheet full of numbers, they used a map of the country’s wealth. This allowed people to see patterns that they might have missed if they were just reading a report.
The Wealth Map used interactive markers. You could click on different parts of the map to see how much people earn in that area. The map was color-coded. Areas with more money were bright, and areas with less money were darker. This created a heat map of the country’s wealth. It allowed users to compare the wealth of one state to the wealth of another state instantly. This is a great way to use geography to simplify complex data. When we use maps this way, we are using our eyes to do the math for us.
This UX strategy was brilliant because it made the data feel personal. Users would immediately look at the wealth of their own hometown. They wanted to see how their local geography compared to the rest of the nation. This is called the self-reference effect. Geographic data is the easiest way to trigger this effect. Because the website was so easy to use, it got many mentions in the news. High-authority websites linked back to it, which helped its SEO. By using maps to explain wealth, the creators made a tool that was both useful and popular.
Case Study 3: Cultural Geography – The Pudding’s Same Name Map
The Pudding is a group that makes visual essays. One of their most famous projects is the Same Name Map. This project looks at the geography of names in the United States. For example, if you are in a certain part of the South, a specific name might be very common. But in the West, that name might be rare. They mapped out these patterns across the geography of the whole country. It is a fun look at how culture and mapping work together.
The features on this map are very smooth. You can type in your own name and see where in the U.S. it is most popular. The map updates in real time. It uses hover effects so that as you move your mouse across the map, the data pops up. This makes the user feel like they are in control of the map. It is not just a static picture of geographical features; it is a living database that responds to your touch. This level of interaction is what makes geography-based features successful.
This project also helped with SEO. Because people love to talk about their own names and where they come from, they shared the map on social media. Each share helped the website rank higher. The map allowed for hyper-local keywords. People would search for things like “most common name in Vermont geography.” This brought in a lot of specific traffic. This case study shows that maps can be used to explore our identity. When we see ourselves on a map, we feel a deep connection to the geographic features that shaped us.
Frequently Asked Questions about Geography in Design
Many people have questions about how geography works on the internet. Here are some of the most common questions and my expert answers.
How do interactive maps improve SEO?
Interactive maps help SEO because they make people stay on a page longer. If a user is clicking on a map to explore geography, they are not leaving your site. Search engines see this and think your site is very good. Also, maps provide signals about your local area. If you are a business in Boston, having a map of your local area helps Google know exactly where you are. This makes you show up more often in local searches.
What are the best interactive geographic features for 2026?
In 2026, the best features use 3D geography. This means the map looks like a real place you can walk through. Another great feature is IP-based geography. This is when a website knows your area as soon as you arrive and shows you things near you. Real-time geography is also popular. This includes maps that show live weather or traffic in your area. These features make the internet feel like it is happening right now in your specific area.
How does geography-based content help with conversions?
Conversions happen when a user takes action, like buying a product. Knowing about a place helps this by building trust. If I can see the place of where a product is made, I feel better about buying it. Also, showing a user their local area makes them feel like the business is close by. People like to buy from their own geography. By using geography-based features, you are telling the customer that you are part of their world.
Technical Implementation: The Biophilic Design Framework
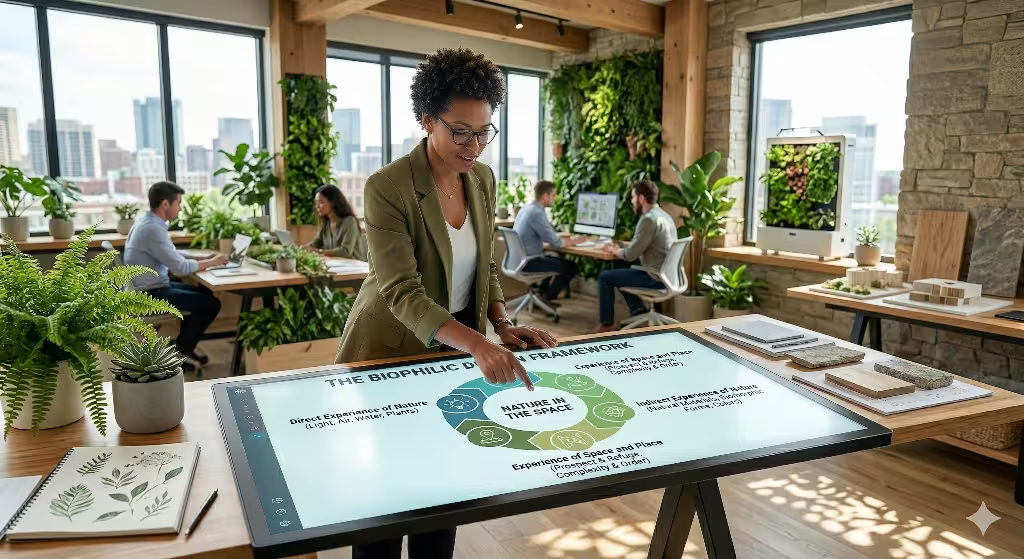
Creating these geographic features requires good computer skills. We use tools like GIS, which stands for Geographic Information Systems. This is the technology that manages all the data about geography. To make a map look great on a website, we often use an API. An API is like a bridge that lets our website talk to a big database of geographic features. Common APIs come from Google Maps or Mapbox. These tools allow us to draw the geography of the earth right on a computer screen.
When we build these maps, we have to think about mobile phones. Most people look at the maps on their phones while they are moving. This is why we use mobile-first design. A map should be easy to move with your finger. If the map is too hard to zoom in on, people will get frustrated. We want the geography to feel fluid and natural. This is a part of biophilic design. Nature does not stutter or lag, and a good map of geographic features should not either. We want the digital geography to be as smooth as a real walk in the woods.
We also have to think about accessibility. This means making sure everyone can use our mapping features, even if they have trouble seeing or using a mouse. We use special code called ARIA labels. These labels describe the features to people who use screen readers. For example, the code might say, “This is a map of the geography of Vermont.” This ensures that the beauty of geography is available to everyone. In biophilic design, we believe that nature and geography are for everyone, and our websites should reflect that.
SEO Strategy: Optimizing for Localized Intent
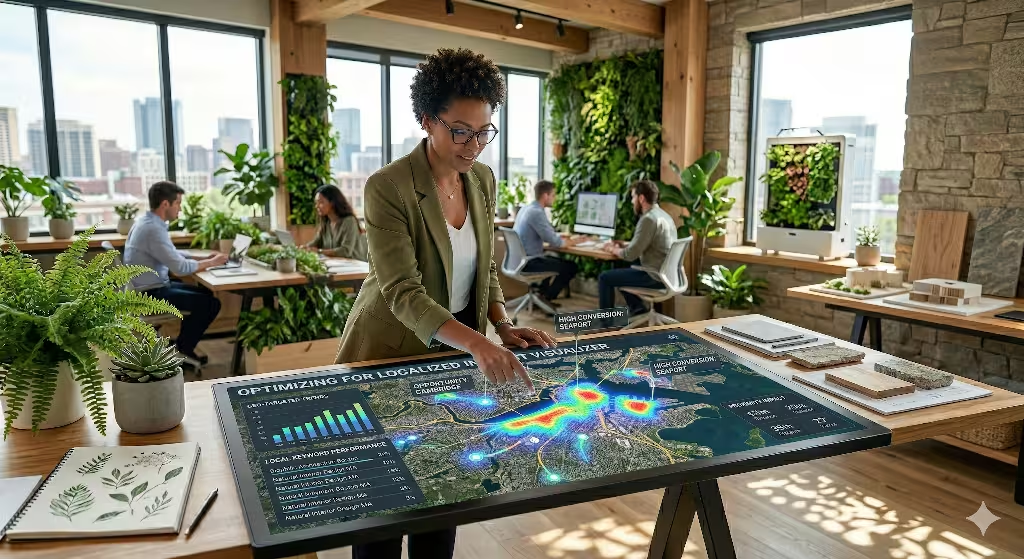
To make a geography project successful, you need a good SEO plan. One way to do this is with schema markup. This is a special kind of code that tells search engines what your geographic data means. If you have a map of your local area, you can use schema to tell Google, “This is my office location in this specific geography.” This helps you show up in the “Map Pack” at the top of search results. Using geography in your code is just as important as using it in your design.
You should also use something called LSI keywords. These are words that are related to geography. Words like “spatial,” “terrain,” “region,” and “location” all help search engines understand that your page is about geography. When you use these words naturally, it builds your authority. You are showing that you are an expert in your field. This is how we at Silphium Design LLC help our clients. We make sure their maps are not just pretty, but also smart and easy for computers to read.
Finally, you must think about speed. Big maps with lots of geographic data can be very slow. If a website takes too long to load, people will leave. We use a trick called lazy loading. This means the geographic data only loads when the user scrolls down to it. This keeps the website fast and keeps the user happy. A fast website is much better than a slow one. We want the experience of geographic data to be instant and exciting.
The Future is Grounded
As we look to the future, geography will only become more important. Our world is becoming more digital, but we are still biological creatures. We need to know our place in the world. Successful Case Studies on Successful Geography-Based Interactive Features show us that people want to be connected to their land. Whether it is through a map of forests or a map of names, geography is the bridge that connects us.
At Silphium Design LLC, we believe that the best websites are the ones that feel grounded. They are websites that respect the area of the user. By using biophilic design and geography, we can make the internet a more beautiful place. We don’t want the internet to be a place where we get lost. We want it to be a place where geographic data helps us find our way home. Geography is the foundation of our stories, our businesses, and our lives.
When you think about your next website project, think about geography. How can you show your users their place in the world? How can you use geography to make your data more interesting? Remember that geography is more than just lines on a paper. Geography is the stage where our lives happen. If you can master the geography of your digital space, you will find success. The future of the web is not in the clouds; it is right here, rooted in the geography of our earth.
Silphium Perspective: As a designer, I value the beauty of the geographic shapes. When these two things work together, we create something truly special. Geography is the ultimate tool for connection. It is the one thing we all share, no matter where we are in the world.