The internet is a vast, placeless void. When you log onto a standard website, you could be anywhere. You might be sitting in a coffee shop in Boston, or you might be in a high-rise in Tokyo. The screen usually looks exactly the same. As a designer with a background in biology and a web designer, I view this as a fundamental flaw in how we build the web. Humans are biological organisms. We evolved to be deeply connected to our physical surroundings. We look for the sun. We listen for the wind. We scan the horizon. When we strip these cues away in the digital world, we create a sense of dissociation.
This is where biophilic design meets the web. By using specific interactive elements, we can root the user in their physical reality. We can make a website feel like it belongs to a specific place and time. This concept is called “vernacular design” in architecture, and we are finally seeing it enter the digital space.
When we talk about interactive elements using local geographic features, we are talking about a conversation between the user and the interface. It is not just about showing a map. It is about the website reacting to the user’s environment. It is about a background that darkens when the sun sets in the user’s city. It is about a menu that ripples like water if the user is near a river. These are not just gimmicks. They are powerful tools that increase dwell time and emotional connection.
In this article, we will explore the technical architecture and the creative design behind these interactive elements. We will look at how to pull data from the real world and paint it onto the screen. We will look at how to make a website feel alive. This approach adds value to the reader by making the experience personal. It adds value to search engines by creating unique, localized content that signals relevance. Let us dismantle the placeless web and build something that feels like home.
Table of Contents
The Technical Architecture of Geographic Interactivity
To build these interactive elements, we first need to understand the tools. The browser is not just a window for text; it is a sensor. It can tell us a lot about where the user is and what is happening around them. However, we must respect privacy. We cannot just take this data. We must ask for it. This “handshake” between the user and the browser is the foundation of all location-based interactive elements.
The Geolocation Handshake
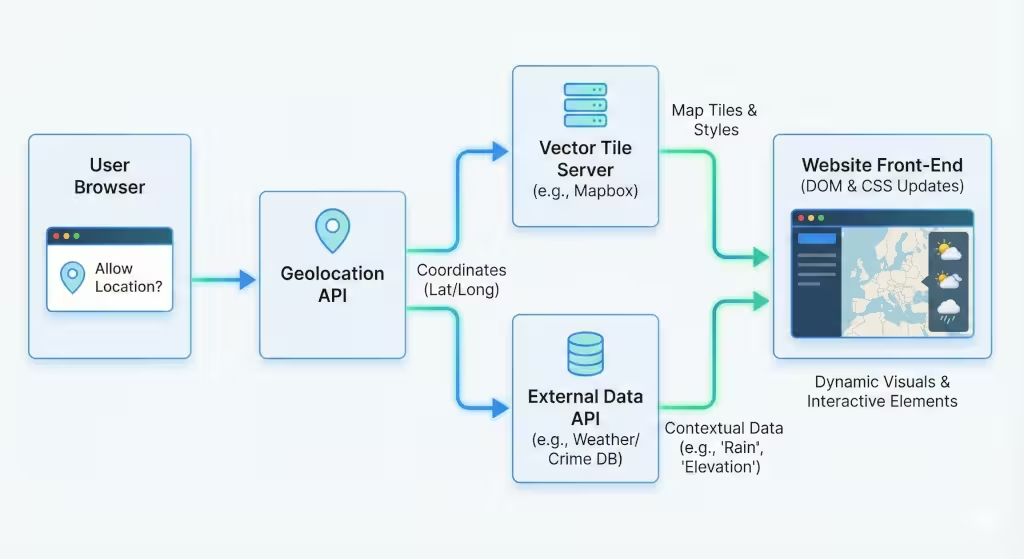
The primary tool we use is the Geolocation API. This is a piece of code built into modern web browsers. When a website wants to use local data, it sends a request. You have likely seen the pop-up box that asks, “Allow this site to know your location?” If the user clicks “Allow,” the browser sends back coordinates. These are the latitude and longitude numbers.
Once we have these numbers, the magic begins. We do not just show the numbers to the user. That would be boring. Instead, we feed these numbers into other systems. We might send them to a weather database to ask, “Is it raining at these coordinates?” or “What is the elevation here?” The answers allows us to change the interactive elements on the screen.
Vector Tiling and Rendering
For visual maps, you can use something called vector tiling. In the old days, online maps were just static pictures stitched together. Today, we use vector tiles. These are mathematical descriptions of the world. They are small data files that tell the browser how to draw lines, shapes, and polygons.
Because these are math-based and not just pictures, they are incredibly light and fast. This allows us to create interactive elements that the user can tilt, rotate, and zoom into without losing quality. Technologies like Mapbox or Google Maps Platform allow us to style these maps to match our brand. We can make the water look like watercolor paint or make the roads look like glowing neon lines. This customization is key to biophilic design. It allows us to present geography in an artistic way.
Data Layers
The final piece of the puzzle is the data layer. A map by itself is just a canvas. To make it useful, we overlay information. This could be a layer showing local bike paths, flood zones, or the migration paths of birds. By stacking these layers, we create complex interactive elements that tell a story. The user can toggle these layers on and off, giving them control over what they see. This sense of control is vital for a good user experience.
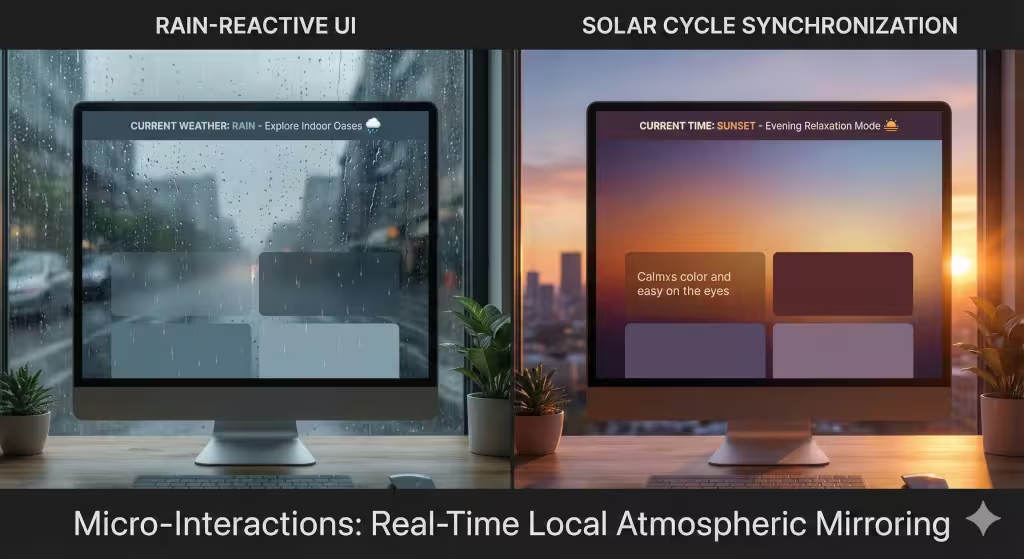
Micro-Interactions: Real-Time Local Atmospheric Mirroring
Biophilic design teaches us that humans have a circadian rhythm. Our bodies react to light and dark. We react to weather. When a website ignores these natural cycles, it creates a subtle cognitive dissonance. It feels fake. Micro-interactions are small, subtle interactive elements that fix this problem by mirroring the user’s local atmosphere.
The Rain-Reactive UI
Imagine a user visits a website while a thunderstorm rages outside their window. If the website is bright, sunny, and cheerful, it feels disconnected. Now, imagine if the website detects that rain. The background image shifts to a moody, overcast tone. Perhaps a subtle animation of raindrops slides down the glass of the screen.
This is a “Rain-Reactive UI.” It works by connecting the user’s location to a weather API. The site checks the condition. If condition = rain, the site triggers specific CSS (styling) changes. These interactive elements validate the user’s reality. It says, “I know where you are, and I am there with you.” This builds immediate trust. It makes the digital space feel permeable, as if the local weather can leak into the browser.
Solar Cycle Synchronization
Another powerful example involves light. We spend hours staring at bright white screens, even late at night. This is bad for our eyes and our sleep cycles. A biophilic website can use interactive elements to sync with the sun.
By using the user’s longitude, we can calculate the exact minute the sun will set in their location. As that time approaches, the website can slowly shift its colors. A bright blue interface might gradually turn to a warm orange, and then to a dark, restful grey. This is not just “Dark Mode.” It is “Natural Mode.” It mimics the setting sun.
These interactive elements are constantly working in the background. They do not require the user to click anything. They simply exist, providing a sense of comfort and biological correctness. It turns a static tool into a dynamic companion.
Macro-Interactions: Topographic Scrollytelling
While micro-interactions are subtle, macro-interactions are bold. They take center stage. One of the most engaging trends in web design is “scrollytelling.” This mixes “scrolling” with “storytelling.” As the user scrolls down the page, they are not just moving text. They are moving through a 3D world. Using local geography makes these interactive elements incredibly compelling.
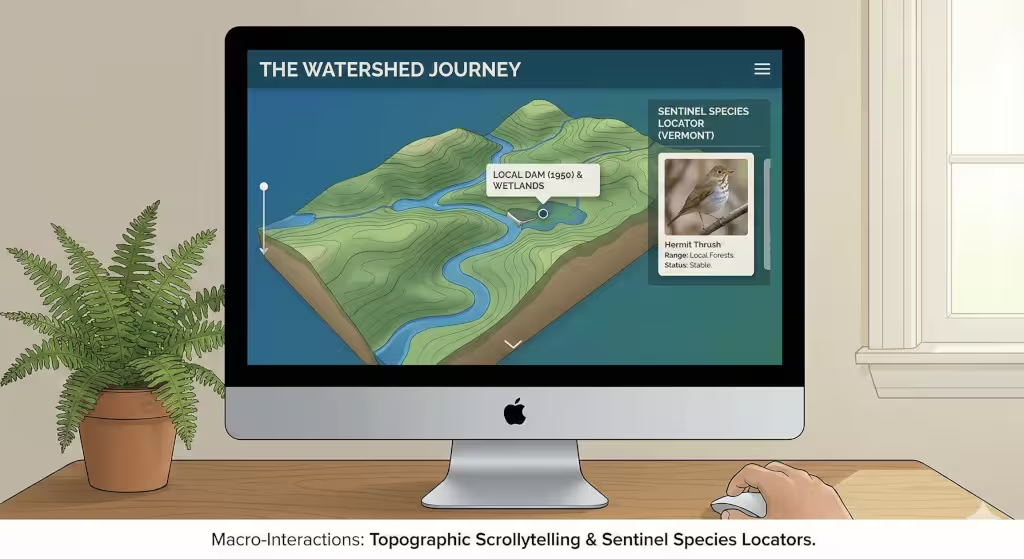
The Watershed Journey
Let us look at an example involving water. Imagine a utility company or an environmental non-profit. Instead of a boring page of text, they use a 3D map of the user’s local watershed.
When the user arrives, the site detects their location. It loads a 3D model of the river nearest to their house. As the user scrolls down, the “camera” flies along the river. It follows the path of the water. Along the way, text boxes fade in to explain local features. “Here is the dam built in 1950.” “Here is the protected wetland.”
These interactive elements turn passive reading into active exploration. The user is on a journey. They can see how their home connects to the larger ecosystem. They can hover their mouse over specific points to see water quality data. This taps into the “Prospect” pattern of biophilic design. It gives the user a view from above, allowing them to understand the lay of the land.
Sentinel Species Locators
Another example focuses on biology. We can build interactive elements that connect users to their wildlife neighbors. A conservation website could detect that a user is in Vermont. Instead of showing generic photos of lions or tigers, the sidebar loads a dynamic card for the “Hermit Thrush,” a bird native to Vermont.
If the user travels to Florida, the site updates. Now it shows a Manatee. These interactive elements can go deeper. We can visualize the range of these animals on a map. We can show where they have been spotted recently. This creates a sense of “co-habitation.” The user realizes they share their physical space with these creatures. It fosters empathy and awareness, which is often the goal of these organizations.
Immersive 3D and Augmented Reality Overlays
If we want to push the boundaries of interactive elements, we look to 3D and Augmented Reality (AR). These technologies used to be too heavy for web browsers. They would crash computers. Today, with better code and faster internet, we can render complex 3D worlds right in Chrome or Safari.
The Virtual Summit
Imagine a website for a hiking gear company. A user wants to buy boots for hiking a specific mountain. We can use a library like Three.js to build a 3D wireframe of that mountain. This is one of the most advanced interactive elements available.
The user can grab the mountain with their mouse. They can spin it around. They can see the steepness of the trails. We can even simulate the lighting. If the user moves a slider, they can see where the shadows will fall at 3:00 PM. This helps them plan their hike. It is useful, beautiful, and deeply engaging. It transforms the shopping experience from a list of products into a virtual reconnaissance mission.
Historical and Geological AR
Augmented Reality allows us to overlay digital data onto the real world using a phone camera. This is the ultimate form of interactive elements because it leaves the browser screen.
Imagine a user standing in a city park. They visit a local history website. The site asks for camera access. When they point their phone at a statue or a building, the site overlays historical information. It might show a line indicating where the floodwaters rose to in a famous storm. It might show the geological layers of rock beneath the pavement.
These interactive elements act like a magic lens. They reveal the hidden layers of a place. For a search engine, this is gold. It signals that the content is highly relevant to that specific GPS coordinate. For the user, it changes how they see their city.
Strategic Questions on Geographic Design
People often ask the same questions about how to implement these ideas. Here are some of the most common questions regarding geographic interactive elements.
How does local geography impact User Experience (UX)?
Local geography grounds the user experience. It increases something called “Place Attachment.” When a user sees their own town or region reflected in the design, they feel understood. This reduces bounce rates (the percentage of people who leave the site immediately). It makes the content feel personally relevant. Interactive elements that focus on location bridge the gap between the screen and the user’s life.
What are the best tools for interactive maps?
There are several great tools. For simple 2D maps, Leaflet.js is excellent. It is lightweight and easy to code. For more complex, custom designs, Mapbox GL is the industry leader. It allows for beautiful vector rendering. If you need high-fidelity 3D, like the “Virtual Summit” example, Google’s Photorealistic 3D Tiles are the cutting edge. Choosing the right tool depends on which interactive elements you need to build.
Can geolocation improve conversion rates?
Absolutely. Geographic relevance acts as a trust signal. A user is significantly more likely to engage with a “Store Locator” that auto-populates their city than one requiring manual typing. When interactive elements anticipate the user’s needs based on location, it removes friction. Less friction means higher conversion rates, whether that is selling a product or signing up for a newsletter.
SEO Implications of Geographic Interactivity
As an expert who monitors search trends, I can tell you that these interactive elements are powerful for Search Engine Optimization (SEO). Google wants to send users to websites that provide value. They measure value in a few ways, and interactive geography hits all the marks.
Dwell Time and Engagement
The most obvious benefit is “Dwell Time.” This is the amount of time a user spends on a page. If a user is spinning a 3D mountain or watching rain fall on the interface, they are staying longer. They are playing with the interactive elements. Google sees this long session duration and assumes the content is excellent. This boosts the page’s ranking.
Local Signals and Schema
When we code these elements, we can add invisible tags called “Schema Markup.” We can tell Google, “This map is about coordinates X and Y.” This validates the entity’s location relevance. If a business claims to be local, but their website is generic, Google might doubt them. If their website is full of interactive elements specific to that city, it is a strong signal of authenticity.
Core Web Vitals and Performance
A word of caution is necessary here. These tools can be heavy. Maps and 3D models use a lot of data. If a page loads too slowly, Google will penalize it. We must be smart about how we load these interactive elements. We use techniques like “lazy loading,” where the map does not load until the user scrolls down to it. We must ensure that the “Cumulative Layout Shift” (CLS) is low. This means the page should not jump around while the map loads. Technical competence is required to balance beauty with performance.
The Future of the Living Website
We are moving away from the era of static, brochure-like websites. We are entering the era of the “Living Website.” These are sites that breathe with the local environment. They know if it is night or day. They know if it is raining. They know the shape of the land beneath the user’s feet.
By using interactive elements grounded in local geography, we satisfy a deep human need. We satisfy the biophilic urge to connect with nature, even through a screen. We also satisfy the search engines, which are hungry for rich, relevant, and engaging content.
For developers and designers, the next step is to start small. You do not need to build a full 3D world tomorrow. Start with a simple API connection. Change your background color based on the local sunrise. Add a small map that shows the user’s watershed. These small interactive elements add up. They create a digital space that respects the physical world. In doing so, we make the internet a little less lonely, and a little more human.