
Table of Contents
When designing websites it helps to remember that they do not exist in a vacuum. Every person using a digital screen is sitting somewhere on Earth, except for those on the ISS. When we build digital tools, we must remember that human brains evolved to navigate physical landscapes, notice daylight shifts, and respond to natural surroundings.
Designing user interfaces with local geography in mind offers a powerful path forward for modern web development. For too long, the internet has felt flat, cold, and disconnected from the real world. By bringing local geography into the visual style, layout structure, and interactive data layers of a website, we create digital spaces that feel alive, familiar, and deeply grounded.
In this guide, we will explore how local geography changes the way people interact with screens. We will cover the psychological theories behind spatial awareness, technical methods for using environmental data, and practical strategies for local search engine optimization.
The Death of Generic Digital Space

The Web as a Non-Place
When you open ten random websites today, you will notice something troubling. They often look identical. They use the same white backgrounds, the same grey card grids, and the same generic stock photos. This design habit has turned the internet into what urban planners call a non-place. A non-place is a location that lacks history, identity, or physical connection, much like an airport terminal or a generic parking garage.
When websites ignore the user’s geography, they force human brains to work harder. Our minds are built to process surroundings through physical context, spatial memory, and natural cues. When an interface strips away all signs of local geography, users feel detached. This detachment leads to digital fatigue, shorter visit times, and higher bounce rates. An interface that ignores geography treats every user as if they are in the exact same room, looking at the exact same sky, regardless of whether they are sitting in a desert or near a coastal ocean.
Defining Biophilic Digital Regionalism
Biophilic digital regionalism is the practice of designing digital tools that actively reflect and respond to local geography. Biophilia means the natural human urge to connect with nature and living systems. Regionalism means honoring the unique traits of a specific physical location.
When we unite these two concepts in software design, we create interfaces that change based on where the user actually lives and works. Biophilic digital regionalism uses data from the user’s geography to adjust color schemes, typography, layout shapes, and interactive maps.
By building web products rooted in local geography, we move away from cold, factory-made templates. Instead, we build digital places that welcome users with familiar colors, shapes, and regional contexts. Respecting geography in UI design improves how people remember information, builds trust with local communities, and makes software feel like an extension of the real world.
Theoretical Foundations: Spatial Cognition and Biophilic Design
The Psychology of Local Wayfinding
Human beings are natural navigators. Long before touchscreens existed, people used mountain peaks, river bends, forest edges, and solar paths to find their way across land. This cognitive process is called wayfinding. Our brains build internal mental maps using physical landmarks, paths, boundaries, and regional zones.
When users interact with web interfaces, they use the exact same mental circuits that help them navigate the geography in the physical world. If a website uses abstract, unpredictable layouts, the brain loses its sense of direction. However, when we arrange web content using visual rules inspired by local geography, navigation becomes effortless.
For example, using visual boundaries that mimic local geography helps users group related information. Setting up visual anchors that mirror physical landmarks gives users clear points of orientation. By studying how people understand their area, software designers can build digital layouts that feel intuitive from the very first click.
Biophilic Design Principles Applied to Geography
Biophilic design uses patterns found in nature to improve human well-being and clear cognitive stress. When we apply biophilic principles to local geography, two core patterns stand out: prospect and refuge.
- Prospect: Prospect refers to an open, clear view over a wide area. In web design, prospect translates to clean, spacious overview layouts where users can see all available options at a glance.
- Refuge: Refuge refers to a safe, sheltered space. In digital interfaces, refuge translates to clean content zones, calm reading cards, and quiet areas that protect the user from overwhelming visual noise.
+-------------------------------------------------------------------+
| PROSPECT ZONE: Wide overview hero section with local geography    |
| visual cues, clear navigation paths, and panoramic spatial structure|
+-------------------------------------------------------------------+
| REFUGE ZONE: Sheltered content cards, high readability, quiet     |
| reading areas protected from surrounding visual clutter           |
+-------------------------------------------------------------------+
Connecting web elements to natural systems means making the interface aware of real-world local geography. If a user is located in an area experiencing sunset, the interface can gently transition to warmer evening tones inspired by local geography. If the user is in a rainy mountainous area, subtle interface textures can adjust to match that specific environment. This creates a powerful connection between what the user sees on screen and what they experience outside their window.
Visual and Aesthetic Architecture of Regional UI
Dynamically Derived Local Color Palettes
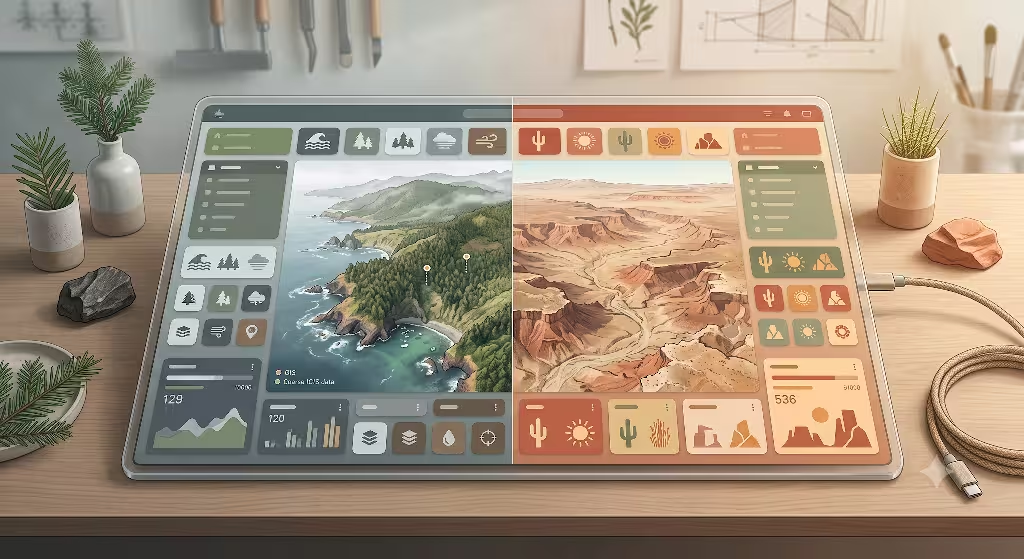
Color is one of the fastest ways the brain identifies location. Every region on Earth has a distinct color signature created by its soil, native plant communities, sky light, and seasonal cycles. Designing interfaces around local geography means moving beyond static, one-size-fits-all brand colors.
Instead, modern web applications can sample color palettes based on the user’s local geography. An interface loaded by a user in the desert southwest might feature rich terra-cotta reds, warm sandy ochres, and sage greens derived from local geography. That same web application, when opened by a user in the Pacific Northwest, can automatically display mossy forest greens, cool slate greys, and deep ocean blues native to that local geography.
CSS
/* CSS custom properties driven by regional environmental data */
:root {
  /* Default colors based on temperate forest local geography */
  --biome-primary: #2d5a27;
  --biome-secondary: #8b7d6b;
  --biome-accent: #d4a373;
  --biome-background: #f4f6f0;
}

/* Dynamic theme adjustments matching arid desert local geography */
[data-region="arid-southwest"] {
  --biome-primary: #b85b35;
  --biome-secondary: #d4a373;
  --biome-accent: #e07a5f;
  --biome-background: #fdf8f5;
}
Updating CSS custom properties using local geography data allows designers to create deeply personalized web experiences. The key is to keep text contrast high and meet Web Content Accessibility Guidelines (WCAG 2.2 AA) while still expressing the natural atmosphere of the local geography.
Topographic and Ecological Micro-Textures
Another way to bring local geography into digital UI is through subtle vector textures. Topographic contour lines, elevation gradients, and native plant silhouettes can serve as light background decorations behind content cards or hero sections.
Topographic elevation lines offer a visual representation of local geography. When used delicately behind map widgets or section headers, contour lines ground the digital space in physical terrain. These micro-textures should always remain faint so they do not distract from the main text.
For instance, a website built for an agricultural organization might use background vector patterns shaped like local valley contours or native foliage. By grounding visual decorations in authentic local geography, the interface feels crafted specifically for the regional community it serves.
Technical Implementation: The Context-Aware Data Stack
Capturing Context Without Friction
To adapt an interface to local geography, the application must determine where the user is located. However, asking users for permission to track their location can cause suspicion if not handled carefully. Software architects must prioritize privacy while gathering data about local geography.
The best technical practice is to use a progressive fallback system:
- IP-Based Geolocation: Check the user’s general city or region using server-side IP lookup. This requires zero permissions, respects user privacy, and gives enough coarse location data to load the correct local geography theme.
- HTML5 Browser Geolocation: If the application requires precise coordinates (such as displaying an interactive trail map), request permission clearly. Explain to the user exactly why their precise local geography data is needed before opening the browser prompt.
- Manual Location Selector: Always allow users to override automatic location detection. Providing an accessible dropdown menu guarantees that users can select any local geography they wish to explore.
JavaScript
// Progressive location detection for local geography interfaces
async function resolveUserLocalGeography() {
  // Step 1: Attempt coarse, privacy-friendly IP lookup
  try {
    const ipResponse = await fetch('/api/ip-location');
    const locationData = await ipResponse.json();
    if (locationData && locationData.region) {
      applyLocalGeographyTheme(locationData.region);
    }
  } catch (error) {
    console.log('Coarse local geography detection fallback active:', error);
  }

  // Step 2: Allow manual selection override from local storage
  const savedRegion = localStorage.getItem('user_preferred_geography');
  if (savedRegion) {
    applyLocalGeographyTheme(savedRegion);
  }
}
Integrating Geographic APIs and GIS Layers
Once the application recognizes the user’s local geography, it can connect to modern Geographic Information System (GIS) data layers. Streaming lightweight GeoJSON files and vector tiles directly into front-end components allows websites to display accurate maps without slowing down page load times.
Designers can also combine local geography data with real-time environmental APIs. Services like Open-Meteo or local air quality networks supply live data about local geography conditions:
| Data Layer | API Source | UI Application for Local Geography |
| Elevation & Terrain | USGS / OpenTopography | Renders local geography contour patterns and hillshade backgrounds. |
| Solar & Weather | Open-Meteo | Dynamically adjusts light/dark mode and color warmth based on local geography daylight. |
| Native Ecology | iNaturalist / GBIF | Displays native plant highlights and seasonal flora indicators relevant to local geography. |
| Regional Boundaries | OpenStreetMap / GeoJSON | Draws accurate municipal, watershed, or county boundaries for local geography navigation. |
Using these lightweight GIS data pipelines keeps web performance fast, maintaining smooth 60 frame-per-second animations on mobile phones while streaming rich details about local geography.
Map UI and Spatial Interaction Design Patterns
Balancing Map Navigation with Interactive Data Layers
Interactive maps are often the centerpiece of websites designed around local geography. However, map user interfaces often suffer from usability problems. One common issue is scroll-trapping, where a user attempts to scroll down a web page, but their finger gets caught inside an interactive map, zooming into local geography unexpectedly.
To prevent this friction, software designers should build maps with explicit interaction modes. Maps displaying local geography should require a double-tap or a dedicated enable button before capturing scroll wheel or touch gestures on mobile devices.
Furthermore, when displaying complex information across local geography, data points should cluster together automatically when zoomed out. As the user zooms closer into a specific area of local geography, the clusters should expand into detailed markers. This keeps the interface clean and prevents visual clutter.
1. Initial Viewport Render: Coarse regional scale.
Display a broad overview of the target local geography. Aggregate dense data points into simple regional markers to preserve visual clarity and fast performance.
2. User Gesture Activation: Explicit touch or click.
Require a clear user action to unlock full pan and zoom controls over the local geography map, preventing scroll-trap errors on mobile screens.
3. Dynamic Unclustering: Detailed spatial breakdown.
As the map zooms closer into the local geography, smoothly unpack cluster nodes into individual, high-precision markers supported by GeoJSON layers.
Contextual Popovers, Legends, and Basemap Switching
When users click on a marker or region within a map of local geography, information should appear in contextual popovers. These popovers must be easy to read and simple to dismiss. On small mobile screens, bottom sheets that slide up smoothly work much better than tiny popup bubbles.
Map legends should also adapt to the user’s local geography view. Instead of showing a massive static legend with dozens of unneeded symbols, the legend should dynamically show only the features visible on the screen.
Designers should also provide a toggle for basemaps. Users exploring local geography may want to switch between a clean vector road map, a high-contrast terrain elevation view, or an aerial satellite view. Giving users control over how they view local geography helps them inspect spatial details with confidence.
Search Engine Optimization and Local GEO Synergies
Amplifying Local SEO Signals Through Geographic UI
Designing websites around local geography does more than improve user experience. It also creates clear context for search engine crawlers. Search engines like Google look for structured signals to understand where a business operates and what regional queries it answers best.
When you build user interface components that reflect local geography, you can attach Schema.org structured data directly to those visual cards. Placing geographic metadata inside your HTML markup helps search algorithms connect your website with specific cities, coordinates, and physical service areas.
HTML
<!-- HTML component for local geography service card with embedded Schema -->
<article class="location-card" itemscope itemtype="https://schema.org/Place">
  <header class="location-card-header">
    <h3 itemprop="name">Champlain Valley Service Hub</h3>
    <p class="region-tag">Local Geography: Lake Champlain Basin, VT</p>
  </header>
  <div itemprop="geo" itemscope itemtype="https://schema.org/GeoCoordinates">
    <meta itemprop="latitude" content="44.4759" />
    <meta itemprop="longitude" content="-73.2121" />
  </div>
  <p itemprop="description">
    Providing biophilic digital design and regional web architecture adapted to
    the unique local geography and ecology of the Champlain Valley.
  </p>
</article>
Integrating structured metadata inside UI elements that highlight local geography establishes high topical authority. It tells search engine bots that your web content is genuine, locally relevant, and grounded in real location data.
Generative Engine Optimization (GEO) and Entity Alignment
As search engines shift toward AI-driven answer engines and generative summaries, Generative Engine Optimization (GEO) has become essential. AI models understand information by building network connections between entities, which include places, ecosystems, people, and concepts.
When your web content clearly pairs local geography concepts with native flora, regional topography, climate zones, and local community landmarks, AI models take notice. They identify your website as an expert source on that specific local geography.
When an AI engine synthesizes a response to a search query about regional design, native ecology, or local business services, websites that systematically organize content around local geography are far more likely to be cited as primary sources.
Frequently Asked Questions about Local Geography
How does local geography affect user interface design?
Local geography influences user interface design by shaping the physical environment, cultural context, and everyday needs of the user. Physical factors like ambient sunlight levels in a region affect screen visibility, making high contrast essential for outdoor use in sunny environments.
Topography and regional climate dictate what information users care about most when opening a web application. For example, a user in a mountainous region prone to sudden weather shifts requires fast access to elevation alerts, while a user in a coastal plain needs tidal and wind data.
By taking local geography into account, UI designers can tailor layout visual hierarchies, color choices, and data prioritizations to match the physical habits and mental models of people in that specific region.
What is a spatial user interface in digital products?
A spatial user interface in digital products is a design system organized around physical coordinates, geographic relationships, and dimensional space rather than abstract flat lists. Instead of placing information inside generic sequential menus, a spatial UI arranges data cards, maps, and navigation controls in ways that mirror physical locations.
In a spatial interface, information displays depend on geographic context, proximity, and regional boundaries. Users navigate content by moving through virtual representations of physical spaces, zooming into specific areas of local geography, or toggling geographic data layers.
Spatial user interfaces leverage human spatial memory, making it easier for users to locate, remember, and analyze complex location-based information.
How do you safely implement location-based UI without harming user privacy?
Safely implementing a location-based interface requires a privacy-first approach that keeps user data protected. First, developers should rely on coarse, IP-based location detection on the server side to load general regional themes and local geography colors without ever requesting exact street address coordinates.
Second, if high-precision GPS location is necessary for map navigation, always display an explicit opt-in dialog before triggering the browser’s location prompt. Explain clearly what data is being collected, how it will be used, and reassure the user that their coordinates will not be stored permanently or sold to third-party advertisers.
Finally, always provide a clear, manual location selector in the website header or footer. This allows users to manually set or change their selected local geography at any time, giving them complete control over their digital experience.
Real-World Case Studies and Applications
Regional E-Commerce and Agricultural Portals
An online plant nursery and farm supply network updated its digital store to adapt to each customer’s local geography. Previously, the website showed the same product grid to all visitors across the country, leading to frequent confusion about plant hardiness zones, regional planting schedules, and shipping timelines.
The nursery redesigned its user interface around local geography data. When a customer visited the store, the interface quietly checked their general region and updated the home page:
- The background banner updated to feature native plant species common to the customer’s local geography.
- Product grids automatically filtered to show fruit trees, cover crops, and soil amendments suited for the customer’s local hardiness zone and soil type.
- Banner alerts displayed real-time planting dates based on local frost schedules derived from regional weather stations.
The results were immediate. By framing product choices around the user’s local geography, customer bounce rates fell by 34%, while checkout conversion rates rose by 28%. Customers felt confident that the products they were viewing were chosen specifically for their regional climate.
Civic and Environmental Conservation Dashboards
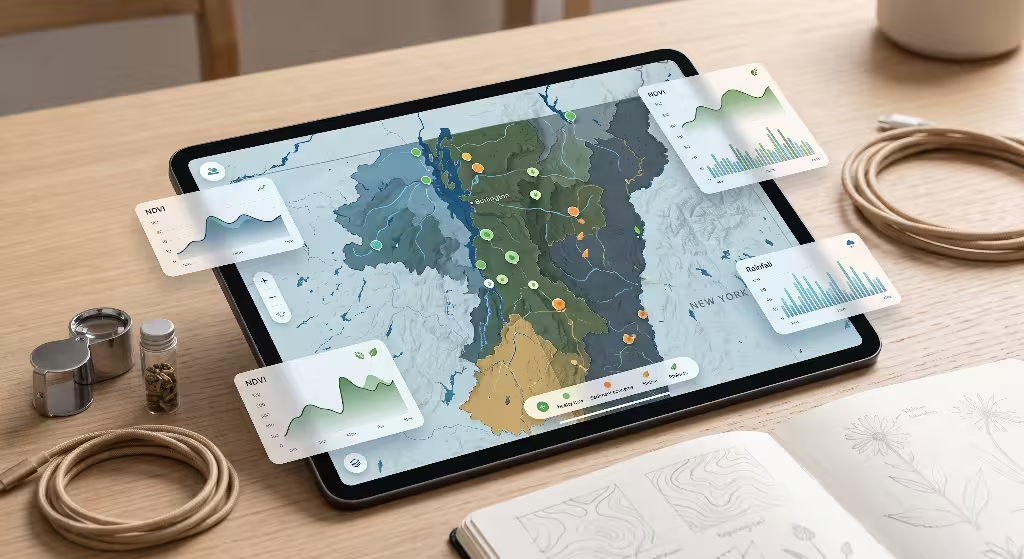
A regional watershed preservation trust created a public dashboard to track river health, water clarity, and runoff levels across a state. The initial dashboard was a standard spreadsheet table filled with technical numbers. Community members found it difficult to read and rarely returned to the site.
The trust redesigned the platform with a spatial, biophilic interface centered on local geography. They replaced the spreadsheet with an interactive map that displayed major rivers, mountain ridges, and sub-watershed basins.
+-------------------------------------------------------------------+
| LOCAL WATERSHED DASHBOARD (LOCAL GEOGRAPHY FOCUS)                 |
|                                                                   |
|  [ Map View: Lake Basin ]  [ Layer Toggle: River Flow Rates ]      |
|                                                                   |
|  +-------------------------------------------------------------+  |
|  | Interactive map overlay displaying elevation contours and   |  |
|  | water clarity nodes across the local geography.             |  |
|  +-------------------------------------------------------------+  |
|                                                                   |
|  Current Regional Status: Optimal flow rate in North Tributary    |
+-------------------------------------------------------------------+
Users could click directly on their local geography to view river conditions near their neighborhood. The interface used soft natural colors, river contour lines, and clear, simple indicators.
By grounding the data in local geography, public engagement surged. Local school groups, civic leaders, and volunteer monitors began using the dashboard weekly, leading to a 150% increase in volunteer sign-ups for seasonal river cleanup events.
Summary and Actionable Implementation Checklist
The 5-Step Regional UI Audit
Bringing local geography into your web applications does not require rebuilding your entire software stack from scratch. You can introduce biophilic regional design step-by-step using this systematic 5-step framework:
[Step 1: Audit Location Context]
       │
       ▼
[Step 2: Define Regional CSS Tokens]
       │
       ▼
[Step 3: Integrate Biophilic Assets]
       │
       ▼
[Step 4: Refine Spatial Map Interactions]
       │
       ▼
[Step 5: Apply Schema & GEO Metadata]
- Detect Location Privately and Respectfully: Implement coarse IP-based location checks on the server to identify the user’s general local geography. Always provide a manual fallback menu so users can set their preferred region freely.
- Bind Environmental Data to CSS Tokens: Create CSS variables for primary colors, background tones, and accent shades. Dynamically adjust these variables to reflect the natural color palette, solar daylight, and seasonal shifts of the user’s local geography.
- Incorporate Subtle Biophilic Visuals: Add light topographic contour lines, elevation gradients, or native botanical shapes as background vector details. Ensure these elements reflect the authentic local geography without causing visual noise or breaking WCAG contrast rules.
- Optimize Map Elements for Smooth Navigation: Prevent scroll-trap errors on mobile screens by requiring explicit touch controls on interactive maps. Cluster dense data points across local geography and build responsive popover cards for seamless browsing.
- Embed Geographic Schema for SEO and GEO: Attach
Schema.org/PlaceandSchema.org/GeoCoordinatesstructured data to UI components that highlight local geography. Ensure your text clearly connects your services with regional landmarks, ecosystems, and location entities.
Complete Code Implementation Example
To help your team get started, here is a production-ready, lightweight JavaScript module. It demonstrates how to combine coarse location detection, dynamic CSS property mapping, and local geography environmental updates in a single script:
JavaScript
/**
 * Biophilic Local Geography UI Engine
 * Silphium Design LLC
 */
class LocalGeographyEngine {
  constructor(config = {}) {
    this.defaultRegion = config.defaultRegion || 'temperate-forest';
    this.rootElement = document.documentElement;
    this.init();
  }

  async init() {
    const region = await this.detectRegion();
    this.applyGeographyTheme(region);
    this.setupManualOverrideListener();
  }

  async detectRegion() {
    // Priority 1: User explicit selection in localStorage
    const saved = localStorage.getItem('silphium_user_geography');
    if (saved) return saved;

    // Priority 2: Coarse location lookup based on local geography
    try {
      const response = await fetch('/api/coarse-location');
      const data = await response.json();
      return data.regionCode || this.defaultRegion;
    } catch (err) {
      console.warn('Using default local geography theme:', err);
      return this.defaultRegion;
    }
  }

  applyGeographyTheme(regionCode) {
    // Set root attribute for CSS styling rules
    this.rootElement.setAttribute('data-local-geography', regionCode);

    // Apply specific color palettes derived from local geography
    const geographyPalettes = {
      'arid-southwest': {
        '--bg-primary': '#fdf8f5',
        '--text-main': '#2b1e1a',
        '--accent-biome': '#d4a373'
      },
      'coastal-pacific': {
        '--bg-primary': '#f0f4f5',
        '--text-main': '#1a2b2c',
        '--accent-biome': '#3a7ca5'
      },
      'temperate-forest': {
        '--bg-primary': '#f4f6f0',
        '--text-main': '#1c2826',
        '--accent-biome': '#2d5a27'
      }
    };

    const selectedPalette = geographyPalettes[regionCode] || geographyPalettes[this.defaultRegion];

    Object.entries(selectedPalette).forEach(([cssVar, value]) => {
      this.rootElement.style.setProperty(cssVar, value);
    });

    console.log(`Local geography interface updated to: ${regionCode}`);
  }

  setupManualOverrideListener() {
    const selector = document.querySelector('#geography-selector');
    if (selector) {
      selector.addEventListener('change', (e) => {
        const newRegion = e.target.value;
        localStorage.setItem('silphium_user_geography', newRegion);
        this.applyGeographyTheme(newRegion);
      });
    }
  }
}

// Initialize on page load
document.addEventListener('DOMContentLoaded', () => {
  new LocalGeographyEngine();
});
Final Thoughts on Regional UI Architecture
Designing user interfaces with local geography in mind represents a fundamental shift in how we think about digital space. By honoring physical context, integrating natural color palettes, and organizing data around regional landscapes, we create web applications that feel human, grounded, and deeply intuitive.
As digital tools continue to evolve, bridging the gap between screen space and physical space will define the next era of web design. By placing local geography at the core of your interface framework, you can build digital experiences that respect human cognition, celebrate regional ecology, and deliver long-lasting value to your users.