
Table of Contents
When we look at a classic, flat paper map of a park, we see lines on a static sheet. It tells you where a path exists, but it cannot convey the living, breathing environment of that land. Modern digital interfaces give us a chance to change that completely. In this guide, we will take you step by step through the technical process of building an interactive nature reserve map using web mapping tools and principles rooted in natural systems.
A computer screen does not have to feel cold or mechanical. By combining WebGL vector graphics with the visual logic of the natural world, we can turn raw geographical coordinates into an exploratory tool. Whether you are building an interactive nature reserve map for a national forest, a regional botanical sanctuary, or a neighborhood land trust, this technical walkthrough shows you how to structure data, write clean browser code, and deploy an accessible experience that works smoothly on any device.
The Paradigm Shift in Ecological Cartography
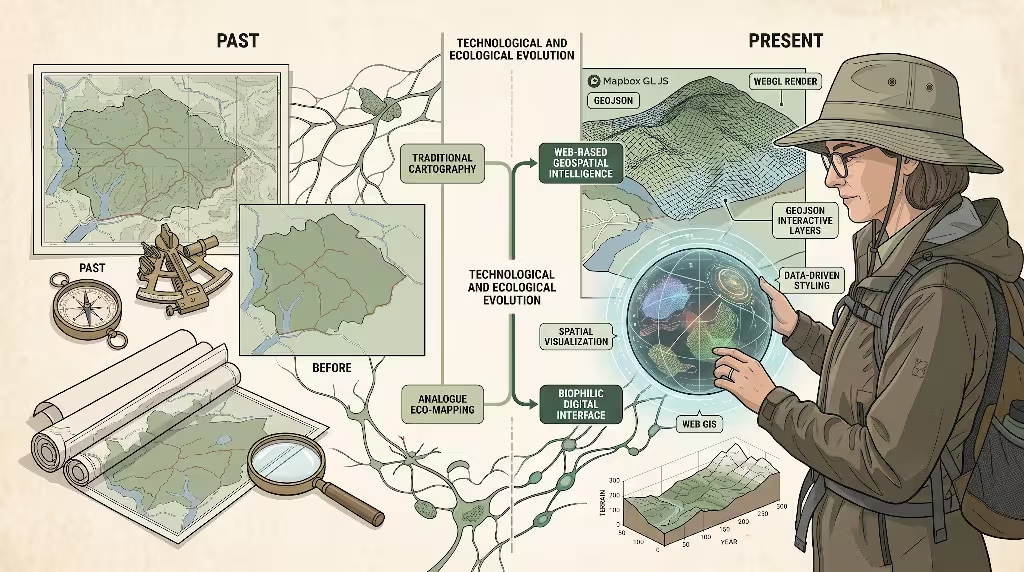
For hundreds of years, maps were frozen records printed on paper or rendered as flat image files online. A visitor looked at an image of a trail and had to guess the incline, the seasonal conditions, or what plants grew beside the stream. If a trail flooded in the spring, the map could not adapt. If an elder needed to know whether a route avoided steep rock scrambles, a static brochure offered few clues.
An interactive nature reserve map represents a major break from those old limitations. Instead of loading static pixels, the browser requests spatial data points, lines, and polygons, and draws them live right inside the visitor computer or mobile device.
This brings several clear advantages to visitors and land managers:
First, an interactive nature reserve map communicates real-time environmental context. When a path closes for muddy trail recovery or eagle nesting season, updating one data file immediately updates the visitor view.
Second, an interactive nature reserve map gives the user direct agency. A hiker can isolate only wheelchair-accessible boardwalks, turn off visual clutter, or click on a creek crossing to inspect current water depths.
Third, an interactive nature reserve map bridges the distance between indoor screens and outdoor landscapes. By letting the visitor explore topography, sun angles, and canopy density before stepping foot on the soil, the digital map becomes an educational gateway rather than an obstacle.
When we build an interactive nature reserve map, our goal is not to keep visitors staring down at their glass phones. Our goal is to give them enough spatial understanding and confidence that they can look up, navigate safely, and appreciate the living ecology around them.
Why Mapbox GL JS for Nature Reserves
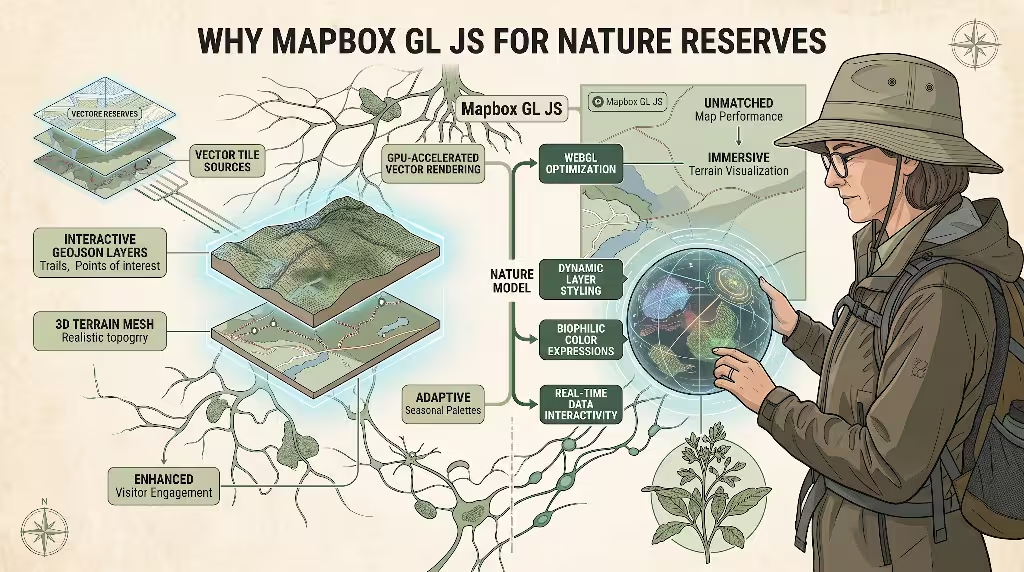
Choosing the correct rendering engine is the most important engineering decision you will make for your project. While there are several open-source libraries available for web mapping, Mapbox GL JS is uniquely suited for building an interactive nature reserve map.
At its core, Mapbox GL JS is a JavaScript library that uses WebGL to render interactive maps from vector tiles and custom spatial data files. Rather than downloading pre-made square image tiles from a server, your browser runs real-time graphics shaders on your device hardware. This brings specific technical advantages:
GPU-Accelerated Vector Rendering
Traditional mapping libraries redraw every visual element as a DOM element or canvas raster. When you load thousands of trail coordinates, markers, and boundary lines, older web maps choke, stutter, and drop frames. Mapbox GL JS talks directly to the graphics processing unit (GPU). It can render thousands of complex trail vertices, elevation contours, and canopy zones smoothly at sixty frames per second.
Smooth Transitions Across Scale
A nature sanctuary requires fluid transitions across very different scales. A visitor starts by viewing the whole regional watershed, zooms into an individual creek valley, and finally inspects a single interpretive garden bed. Because an interactive nature reserve map powered by vector tiles recalculates positions continuously, labels do not jump or blur. They transition smoothly without flickering.
Dynamic Styling and Biophilic Color Controls
Nature is never static. Its colors shift with the hours of the day and the changing seasons. Mapbox GL JS allows you to write style expressions that adapt automatically. You can program your interactive nature reserve map to use fresh greens in the morning, warm ambers at sunset, and cool, muted tones at night. You can even tie color palettes to the current month to reflect blooming or leaf-drop cycles.
What We Are Constructing in this Article
Throughout this guide, we are going to build a production-ready interactive nature reserve map from the ground up.
By the end of this tutorial, your interactive nature reserve map will include:
- A clear base map with a custom, nature-focused color palette.
- A three-dimensional digital elevation terrain that shows real hills, ridges, and valleys.
- Multi-tiered vector layers displaying nature reserve boundaries, public hiking trails, and sensitive habitat sanctuaries.
- Interactive point-of-interest markers for trailheads, scenic overlooks, observation decks, and water stations.
- Fast click and hover event listeners that bring up rich information popups.
- A responsive sidebar interface that lets visitors filter trails by difficulty and distance.
- Mobile-friendly camera controls and location tracking to help people orient themselves while out on the path.
Let us begin by assembling our tools and preparing our spatial files.
Development Stack Initialization and API Security
Before writing any mapping logic, we must set up our project workspace and secure our access credentials.
To power an interactive nature reserve map with Mapbox services, you need an active Mapbox account and an access token. Mapbox provides a generous free tier that easily accommodates small to medium conservation sites, educational centers, and local land trusts without recurring fees.
Securing Your Access Token
Your access token is a unique public key that identifies your application. Because this key lives in client-side code, you must protect it from unauthorized use.
- Log in to your Mapbox account dashboard.
- Create a brand-new token specifically designated for your interactive nature reserve map.
- Under the URL restrictions panel, add your exact domain names (for example,
[https://yourdomain.org](https://yourdomain.org)and your local testing hosthttp://localhost:8080). - Never leave your token completely open without URL restrictions. Otherwise, other websites could steal your key and consume your free usage tier.
Setting Up the HTML Shell
We will structure our interactive nature reserve map with a modern HTML page. You can import the required Mapbox GL JS library files directly through a content delivery network or package them using npm. For clarity, we will load the assets directly in our markup:
HTML
<!DOCTYPE html>
<html lang="en">
<head>
  <meta charset="UTF-8">
  <meta name="viewport" content="width=device-width, initial-scale=1.0">
  <title>Whispering Pines Nature Reserve Map</title>

  <!-- Mapbox GL JS CSS -->
  <link href="https://api.mapbox.com/mapbox-gl-js/v3.3.0/mapbox-gl.css" rel="stylesheet">

  <!-- Mapbox GL JS JavaScript -->
  <script src="https://api.mapbox.com/mapbox-gl-js/v3.3.0/mapbox-gl.js"></script>

  <style>
    body, html {
      margin: 0;
      padding: 0;
      height: 100%;
      width: 100%;
      font-family: system-ui, -apple-system, BlinkMacSystemFont, "Segoe UI", Roboto, sans-serif;
      overflow: hidden;
    }

    #map {
      position: absolute;
      top: 0;
      bottom: 0;
      width: 100%;
      height: 100%;
    }

    /* Floating control panel */
    .map-overlay {
      position: absolute;
      top: 16px;
      left: 16px;
      background: rgba(255, 255, 255, 0.92);
      backdrop-filter: blur(6px);
      padding: 16px 20px;
      border-radius: 8px;
      box-shadow: 0 4px 16px rgba(0, 0, 0, 0.12);
      max-width: 320px;
      z-index: 10;
    }

    .map-overlay h1 {
      font-size: 1.15rem;
      margin: 0 0 8px 0;
      color: #1f3b25;
    }

    .map-overlay p {
      font-size: 0.85rem;
      margin: 0 0 12px 0;
      color: #4a5d4e;
      line-height: 1.4;
    }
  </style>
</head>
<body>

  <div id="map"></div>

  <div class="map-overlay">
    <h1>Whispering Pines Reserve</h1>
    <p>Explore protected woodlands, native wetlands, and marked hiking paths on this interactive nature reserve map.</p>
    <div id="trail-filters"></div>
  </div>

  <script>
    // Initialize our token
    mapboxgl.accessToken = 'YOUR_MAPBOX_ACCESS_TOKEN';
  </script>
</body>
</html>
Always verify that the version number of the CSS link matches the version number of the JavaScript file. If these two files get out of sync, your interactive nature reserve map can suffer from misaligned popups, broken zoom buttons, and weird rendering bugs.
Data Formatting for Natural Spaces: GeoJSON and TopoJSON
A digital map is only as good as the geographic information it carries. To build an interactive nature reserve map that works reliably, your data must follow universal web standards.
The most widely supported spatial format is GeoJSON. GeoJSON is an open format based on JavaScript Object Notation that represents points, lines, polygons, and their custom attributes.
For our interactive nature reserve map, we will organize our data into three separate GeoJSON files:
reserve-boundaries.geojson: Polygons that outline the legal borders of the property and special conservation zones.trails.geojson: LineStrings that represent footpaths, boardwalks, and interpretive routes.points-of-interest.geojson: Points that mark physical landmarks, trailheads, educational signs, and water sources.
Structuring Rich Feature Properties
Many developers make the mistake of only saving coordinates. To make an interactive nature reserve map truly valuable for visitors, you must attach helpful metadata to the properties block of every single feature.
Here is an example of an informative LineString for a nature trail in our trails.geojson file:
JSON
{
  "type": "Feature",
  "geometry": {
    "type": "LineString",
    "coordinates": [
      [-79.6845, 41.6281],
      [-79.6841, 41.6287],
      [-79.6834, 41.6295],
      [-79.6821, 41.6304]
    ]
  },
  "properties": {
    "id": "trail-hemlock-loop",
    "name": "Hemlock Ravine Loop",
    "difficulty": "Moderate",
    "surface": "Packed earth and tree roots",
    "length_miles": 2.4,
    "elevation_gain_ft": 280,
    "blaze_color": "#2e7d32",
    "wheelchair_accessible": false,
    "description": "Follows the north bank of Oil Creek through mature eastern hemlocks and mossy boulders."
  }
}
Notice how much practical value these properties provide. When a hiker taps this line on your interactive nature reserve map, your code can read these values to build a comprehensive summary box.
Structuring Point Features
Similarly, here is an example of a point of interest inside points-of-interest.geojson:
JSON
{
  "type": "Feature",
  "geometry": {
    "type": "Point",
    "coordinates": [-79.6845, 41.6281]
  },
  "properties": {
    "id": "poi-main-trailhead",
    "name": "North Meadow Trailhead",
    "category": "trailhead",
    "amenities": ["Parking", "Restrooms", "Potable Water", "Interpretive Kiosk"],
    "notes": "Open dawn to dusk. Please carry out all trash."
  }
}
By organizing your files with clean properties, your interactive nature reserve map becomes much easier to style, query, and filter later on.
Geospatial Hygiene: Projections and Coordinate Cleaning
Before you load spatial data into an interactive nature reserve map, you must inspect the coordinate system.
Geographic information systems (GIS) use many different Coordinate Reference Systems (CRS). Local municipal files, forestry surveys, and engineering prints often use State Plane or UTM projections. These regional systems measure locations in feet or meters based on local grids rather than latitude and longitude.
If you load State Plane data directly into Mapbox, your features will not appear on the screen, or they will show up thousands of miles away in the middle of the ocean.
Standardizing on WGS 84
Web mapping engines require the WGS 84 geographic coordinate reference system, also known by its official authority code: EPSG:4326.
In EPSG:4326, coordinates are written as decimal degrees:
- Longitude ranges from -180 to +180 (East and West of the Prime Meridian).
- Latitude ranges from -90 to +90 (North and South of the Equator).
Keep in mind that standard GeoJSON places Longitude first and Latitude second: [longitude, latitude]. This trips up many developers because common speech usually says “latitude and longitude.” If your interactive nature reserve map shows lines running across Antarctica instead of your home state, check whether your coordinates were accidentally reversed.
Cleaning Your Data with Open Tools
You do not need costly proprietary software to prepare your spatial layers. You can clean and convert your data using open-source tools:
- QGIS: Download QGIS to import your local forestry shapefiles, inspect their attribute tables, and re-export them as GeoJSON in EPSG:4326.
- Mapshaper: If your spatial files are huge, visit
mapshaper.org. Drop in your files and run coordinate simplification. Natural river borders and contour boundaries often contain unnecessary micro-vertices. Reducing the coordinate resolution slightly can trim your file size by seventy percent without losing visual quality on an interactive nature reserve map.
Designing an Organic Cartographic Palette
When designing an interactive nature reserve map, standard road navigation styles are completely counterproductive. Standard navigation maps highlight four-lane highways, gas stations, shopping centers, and concrete infrastructure.
A natural sanctuary requires a thoughtful, biophilic design approach. Biophilic design means aligning digital interfaces with the colors, textures, and patterns of the living world. The map should feel serene, organic, and calm. It should emphasize the natural landforms rather than human roadways.
Color Palette Strategy for Conservation Maps
Here is a tested, highly readable color hierarchy designed specifically for an interactive nature reserve map:
| Land Feature | Hex Code | Visual Character | Purpose |
| Forest Canopy | #d4e4d1 | Soft sage green | Indicates wooded ground without overpowering text |
| Wetlands / Marshes | #c7ded9 | Pale aqua mint | Separates damp soils from deep open water |
| Lakes and Rivers | #a3c9d7 | Muted cool blue | Clear water presence with high contrast |
| Open Meadows | #f3ede2 | Warm flaxen cream | Shows grasslands, clearings, and fields |
| Reserve Boundaries | #2d5a3c | Deep pine green | Clearly defines protected conservation limits |
| Main Hiking Trails | #b85d19 | Terracotta / Sienna | High visibility across both forest and meadow layers |
| Secondary Trails | #7d6350 | Earthy umber brown | Subdued trails that prevent visual overload |
Field Visibility and Contrast
Remember that visitors will look at your interactive nature reserve map on their phones while standing outside under direct sunlight. Subtle shades of light gray will wash out and become unreadable outdoors. Make sure that your trail colors, text labels, and warning icons maintain strong contrast against the base terrain.
Initializing the Map Container
With our styles planned and our assets imported, we can write the JavaScript code to initialize the map instance.
We will place our logic inside a main script tag. We start by defining where the camera should point when the interactive nature reserve map first opens on the screen:
JavaScript
// Define the geographic bounds of our nature reserve
// Format: [Southwest Corner Longitude/Latitude, Northeast Corner Longitude/Latitude]
const reserveBounds = [
  [-79.7200, 41.6100], // Southwest coordinates
  [-79.6400, 41.6600]  // Northeast coordinates
];

// Initialize the map object
const map = new mapboxgl.Map({
  container: 'map', // The ID of our HTML div
  style: 'mapbox://styles/mapbox/outdoors-v12', // A balanced base outdoor style
  center: [-79.6845, 41.6281], // Starting longitude and latitude
  zoom: 13.5, // Starting zoom level
  minZoom: 11, // Prevent zooming out into outer space
  maxZoom: 18, // Prevent zooming in past the tree tops
  maxBounds: reserveBounds, // Keep the user focused on the reserve area
  pitch: 35, // Tilt the view slightly for depth
  bearing: 15 // Rotate slightly to align with the main valley
});

// Add standard navigation controls (zoom in/out and compass)
map.addControl(new mapboxgl.NavigationControl({
  showCompass: true,
  visualizePitch: true
}), 'bottom-right');

// Add scale indicator so hikers can estimate walking distances
map.addControl(new mapboxgl.ScaleControl({
  maxWidth: 160,
  unit: 'imperial'
}), 'bottom-left');
By adding maxBounds to the map configuration, you prevent visitors from accidentally dragging the view off to another continent. The camera stays gently bounded around the protected nature preserve.
Integrating 3D Terrain and Hillshading
One of the biggest shortcomings of standard park brochures is their inability to show steep vertical changes. A trail that looks like a short, straight line might actually climb five hundred feet up a sharp rocky ridge.
Mapbox GL JS lets you pull in high-resolution Digital Elevation Models (DEM) through raster elevation tiles. By enabling three-dimensional terrain on your interactive nature reserve map, you give visitors an immediate, intuitive understanding of the physical landscape.
Here is how you add three-dimensional elevation and custom atmospheric lighting:
JavaScript
map.on('load', () => {
  // 1. Add Mapbox global terrain-rgb raster elevation source
  map.addSource('mapbox-dem', {
    type: 'raster-dem',
    url: 'mapbox://mapbox.mapbox-terrain-dem-v1',
    tileSize: 512,
    maxzoom: 14
  });

  // 2. Activate the 3D terrain mesh
  map.setTerrain({
    source: 'mapbox-dem',
    exaggeration: 1.25 // Subtle boost to make rolling topography clearer
  });

  // 3. Add soft atmospheric sky and fog
  map.setFog({
    'range': [-1, 2],
    'horizon-blend': 0.15,
    'color': '#e8efe9', // Soft morning-fog tint
    'high-color': '#c2d7e9',
    'space-color': '#000000',
    'star-intensity': 0.0
  });
});
Using an exaggeration setting between 1.1 and 1.3 is ideal for an interactive nature reserve map. If you push the exaggeration number too high, gentle hills will look like jagged mountains, confusing hikers about the actual effort required. A modest setting provides realistic depth while keeping the landscape readable.
Adding Data Layers to the Mapbox Instance
Always place your layer additions inside the map.on('load') callback. If you attempt to add sources or layers before the base style has finished loading, the browser will throw errors.
Let us add our three GeoJSON datasets to our interactive nature reserve map: boundaries, trails, and points of interest.
JavaScript
map.on('load', () => {
  // Load our trails GeoJSON
  map.addSource('reserve-trails', {
    type: 'geojson',
    data: 'data/trails.geojson',
    generateId: true // Essential for fast hover states!
  });

  // Load our conservation boundaries GeoJSON
  map.addSource('reserve-boundary', {
    type: 'geojson',
    data: 'data/reserve-boundaries.geojson'
  });

  // Load our points of interest GeoJSON
  map.addSource('reserve-pois', {
    type: 'geojson',
    data: 'data/points-of-interest.geojson'
  });

  // --- LAYER 1: RESERVE BOUNDARY FILL ---
  map.addLayer({
    id: 'boundary-fill',
    type: 'fill',
    source: 'reserve-boundary',
    paint: {
      'fill-color': '#2d5a3c',
      'fill-opacity': 0.08
    }
  });

  // --- LAYER 2: RESERVE BOUNDARY OUTLINE ---
  map.addLayer({
    id: 'boundary-outline',
    type: 'line',
    source: 'reserve-boundary',
    paint: {
      'line-color': '#2d5a3c',
      'line-width': 2,
      'line-dasharray': [3, 2] // Dashed boundary line
    }
  });

  // --- LAYER 3: HIKING TRAILS ---
  map.addLayer({
    id: 'trails-line',
    type: 'line',
    source: 'reserve-trails',
    layout: {
      'line-join': 'round',
      'line-cap': 'round'
    },
    paint: {
      // Dynamic color matching the blaze property from our GeoJSON
      'line-color': ['coalesce', ['get', 'blaze_color'], '#b85d19'],

      // Interpolate line thickness based on camera zoom level
      'line-width': [
        'interpolate', ['linear'], ['zoom'],
        11, 1.5,
        14, 3.5,
        17, 6.0
      ],
      // Highlight trail on hover using feature-state
      'line-opacity': [
        'case',
        ['boolean', ['feature-state', 'hover'], false],
        1.0,
        0.75
      ]
    }
  });

  // --- LAYER 4: POINTS OF INTEREST CIRCLES ---
  map.addLayer({
    id: 'poi-markers',
    type: 'circle',
    source: 'reserve-pois',
    paint: {
      'circle-radius': [
        'interpolate', ['linear'], ['zoom'],
        12, 5,
        16, 9
      ],
      'circle-color': '#ffffff',
      'circle-stroke-width': 3,
      'circle-stroke-color': '#1f3b25'
    }
  });
});
Look closely at the line-width expression used above. By using the interpolate command, our interactive nature reserve map ensures that trail lines stay thin and tidy when zoomed out, but expand smoothly as the visitor zooms down to path level. This prevents the map from becoming an illegible knot of thick lines when viewing the entire park.
Implementing Rich Interactivity and Layer Logic
An interactive nature reserve map needs to respond immediately when someone interacts with it. We want trails to glow slightly when the cursor passes over them, and we want informative popups to appear when features are tapped.
High-Performance Hover States with setFeatureState
Many beginning developers change feature styles by re-filtering or rewriting GeoJSON data. That approach is slow and causes noticeable stuttering. Mapbox GL JS provides a dedicated system called setFeatureState that updates visual properties directly on the GPU without recalculating geometry.
Here is how we wire up responsive hover behavior for our trails:
JavaScript
let hoveredTrailId = null;

// Listen for mouse movement over the trails layer
map.on('mousemove', 'trails-line', (e) => {
  if (e.features.length > 0) {
    // Change cursor to pointer to signal clickability
    map.getCanvas().style.cursor = 'pointer';

    // If we were hovering over a previous trail, clear its state
    if (hoveredTrailId !== null) {
      map.setFeatureState(
        { source: 'reserve-trails', id: hoveredTrailId },
        { hover: false }
      );
    }

    // Set hover state on the active trail
    hoveredTrailId = e.features[0].id;
    map.setFeatureState(
      { source: 'reserve-trails', id: hoveredTrailId },
      { hover: true }
    );
  }
});

// Clear hover state when the mouse leaves the trails layer
map.on('mouseleave', 'trails-line', () => {
  map.getCanvas().style.cursor = '';
  if (hoveredTrailId !== null) {
    map.setFeatureState(
      { source: 'reserve-trails', id: hoveredTrailId },
      { hover: false }
    );
  }
  hoveredTrailId = null;
});
Because we added generateId: true when loading the source, every trail has a distinct numeric identifier that setFeatureState can reference instantly.
Informative Trail Popups
When a visitor taps or clicks a trail on your interactive nature reserve map, we display an accessible popup containing the property data we saved earlier:
JavaScript
map.on('click', 'trails-line', (e) => {
  const feature = e.features[0];
  const props = feature.properties;

  // Build clean HTML content from our GeoJSON properties
  const popupHtml = `
    <div style="font-family: inherit; padding: 4px;">
      <h3 style="margin: 0 0 4px 0; color: #1f3b25; font-size: 1.05rem;">
        ${props.name}
      </h3>
      <p style="margin: 0 0 8px 0; font-size: 0.85rem; color: #4a5d4e;">
        ${props.description}
      </p>
      <ul style="margin: 0; padding-left: 16px; font-size: 0.8rem; color: #333;">
        <li><strong>Difficulty:</strong> ${props.difficulty}</li>
        <li><strong>Length:</strong> ${props.length_miles} miles</li>
        <li><strong>Elevation Gain:</strong> ${props.elevation_gain_ft} ft</li>
        <li><strong>Surface:</strong> ${props.surface}</li>
        <li><strong>Wheelchair Access:</strong> ${props.wheelchair_accessible ? 'Yes' : 'No'}</li>
      </ul>
    </div>
  `;

  // Attach and open the popup at the exact click location
  new mapboxgl.Popup({ offset: [0, -8], maxWidth: '300px' })
    .setLngLat(e.lngLat)
    .setHTML(popupHtml)
    .addTo(map);
});
This popup gives hikers immediate, practical answers. They do not have to flip between screens or decipher small paper legends. Everything they need appears right on the map.
Layer Filtering and Interactive UI Controls
A large park can have dozens of intersecting pathways. A beginner looking for a flat, easy walk might feel overwhelmed by a map displaying thirty different routes. Adding a layer filter to your interactive nature reserve map lets visitors declutter their screen and find paths that fit their abilities.
Let us add simple filter buttons to the floating control box we created in our HTML:
HTML
<!-- Inside our .map-overlay container -->
<div id="trail-filters">
  <span style="font-size: 0.8rem; font-weight: 600; color: #1f3b25; display: block; margin-bottom: 6px;">
    Filter by Difficulty:
  </span>
  <button class="filter-btn active" data-difficulty="all">All</button>
  <button class="filter-btn" data-difficulty="Easy">Easy</button>
  <button class="filter-btn" data-difficulty="Moderate">Moderate</button>
  <button class="filter-btn" data-difficulty="Strenuous">Strenuous</button>
</div>

<style>
  .filter-btn {
    background: #eef3ee;
    border: 1px solid #c8d7c8;
    color: #2d5a3c;
    padding: 4px 10px;
    border-radius: 4px;
    font-size: 0.75rem;
    cursor: pointer;
    margin-right: 4px;
    margin-bottom: 4px;
  }
  .filter-btn.active {
    background: #2d5a3c;
    color: #ffffff;
    border-color: #2d5a3c;
  }
</style>
Now we attach a simple click listener to these buttons that uses the Mapbox setFilter method:
JavaScript
document.querySelectorAll('.filter-btn').forEach((button) => {
  button.addEventListener('click', (event) => {
    // Manage visual button active states
    document.querySelectorAll('.filter-btn').forEach(b => b.classList.remove('active'));
    event.target.classList.add('active');

    const selectedDifficulty = event.target.getAttribute('data-difficulty');

    if (selectedDifficulty === 'all') {
      // Clear the filter to show all trails
      map.setFilter('trails-line', null);
    } else {
      // Apply filter matching our GeoJSON difficulty property
      map.setFilter('trails-line', ['==', ['get', 'difficulty'], selectedDifficulty]);
    }
  });
});
Notice how quickly this executes. Because the data is already stored in client memory, filtering does not require any network requests. The non-matching paths disappear instantly, giving the visitor a clear view of their options on your interactive nature reserve map.
Advanced Enhancements: Spatial Analysis and Wayfinding
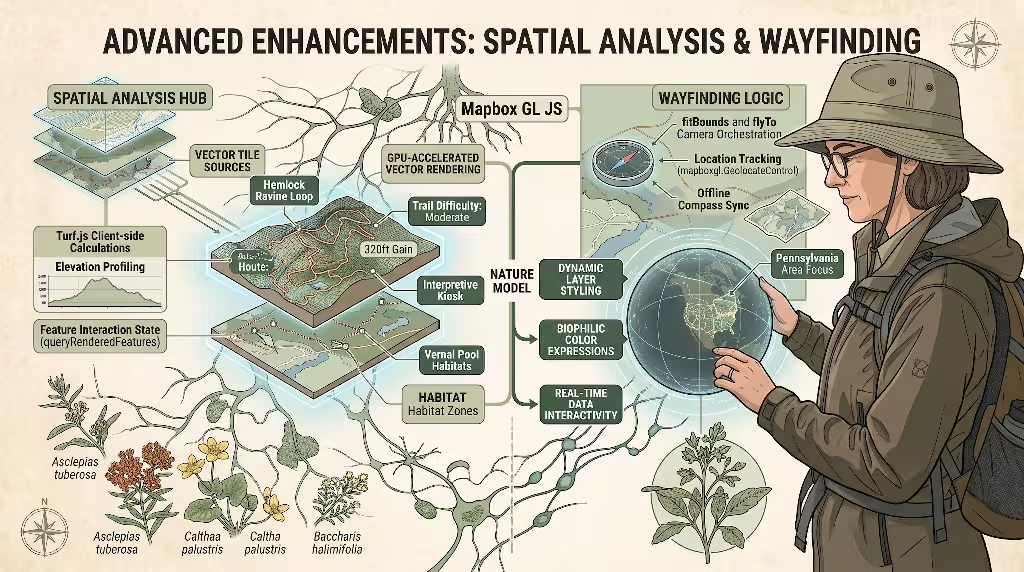
Once your primary map layers and popups are operating smoothly, you can introduce advanced features that help visitors navigate the terrain with confidence.
Smooth Camera Refocusing with fitBounds
Never expect visitors on mobile phones to pinch, drag, and search for the main trail sections manually. You can provide preset quick-links that glide the camera to key areas using map.fitBounds():
JavaScript
function zoomToTrail(coordinatesArray) {
  // Calculate bounding box using simple min/max coordinates
  const bounds = coordinatesArray.reduce((acc, coord) => {
    return [
      [Math.min(acc[0][0], coord[0]), Math.min(acc[0][1], coord[1])],
      [Math.max(acc[1][0], coord[0]), Math.max(acc[1][1], coord[1])]
    ];
  }, [[coordinatesArray[0][0], coordinatesArray[0][1]], [coordinatesArray[0][0], coordinatesArray[0][1]]]);

  // Glide the camera to encircle the entire trail path
  map.fitBounds(bounds, {
    padding: { top: 60, bottom: 60, left: 60, right: 60 },
    duration: 1800, // Smooth transition over 1.8 seconds
    essential: true
  });
}
Real-Time Location Tracking Outdoors
A major reason hikers pull out an interactive nature reserve map is to answer one fundamental question: “Where am I right now?”
Mapbox GL JS includes a built-in geolocation control that hooks directly into the GPS hardware of smartphones and tablets:
JavaScript
// Add device location tracking control
const geolocate = new mapboxgl.GeolocateControl({
  positionOptions: {
    enableHighAccuracy: true // Use real GPS satellite chips rather than coarse cell tower estimates
  },
  trackUserLocation: true, // Keep following the user as they walk
  showUserHeading: true // Show an arrow pointing in the direction the device is facing
});

map.addControl(geolocate, 'top-right');
When a visitor steps onto a trail, tapping this button centers their position on the interactive nature reserve map and displays a pulsing blue indicator that moves alongside them as they hike through the woods.
Performance Optimization, Accessibility, and Technical SEO
Building an interactive nature reserve map that looks sharp on a desktop monitor in an office is easy. Ensuring that same map performs flawlessly on a low-cost mobile phone in the middle of a forest requires deliberate optimization.
Vector Tile Clustering for Ecological Observations
If your interactive nature reserve map includes crowdsourced observations, bird sightings, or botanical records, you could easily have thousands of point features. Rendering thousands of separate circle markers will degrade performance and clutter the screen.
Enable point clustering on your GeoJSON source:
JavaScript
map.addSource('wildlife-observations', {
  type: 'geojson',
  data: 'data/observations.geojson',
  cluster: true,
  clusterMaxZoom: 14, // Stop clustering at trail-level zoom
  clusterRadius: 50 // Pixel radius of each cluster bucket
});
Clustering groups nearby points into a single numeric bubble. When the hiker zooms in closer, the cluster splits apart into individual markers. This keeps your interactive nature reserve map snappy, responsive, and legible.
Semantic Accessibility (a11y)
Search engine bots and screen-reader software cannot read raw coordinates rendered inside a WebGL <canvas> element. If your interactive nature reserve map is the only thing on the page, visually impaired users and web crawlers will see an empty box.
To make your project accessible and search-engine friendly:
- Provide a hidden or collapsible semantic HTML table beneath your map that lists every trail name, length, difficulty, and current status.
- Ensure all interactive buttons and filter controls have clear
aria-labeltags. - Add Schema.org structured data to your page markup. Using schemas like
Place,Park, orTouristAttractiontells search engines that your page hosts an interactive nature reserve map for an active conservation site.
Here is an example of an accompanying semantic table that should live in your page markup:
HTML
<section class="visually-hidden-table">
  <h2>Available Trails at Whispering Pines</h2>
  <table>
    <thead>
      <tr>
        <th>Trail Name</th>
        <th>Difficulty</th>
        <th>Length</th>
        <th>Accessibility</th>
      </tr>
    </thead>
    <tbody>
      <tr>
        <td>Hemlock Ravine Loop</td>
        <td>Moderate</td>
        <td>2.4 miles</td>
        <td>Natural surface, not accessible</td>
      </tr>
      <tr>
        <td>Meadow Boardwalk</td>
        <td>Easy</td>
        <td>0.8 miles</td>
        <td>Wheelchair and stroller accessible</td>
      </tr>
    </tbody>
  </table>
</section>
This ensures that anyone using assistive technology can read every trail detail, while giving search engines rich text to index alongside your interactive nature reserve map.
Frequently Asked Questions about Interactive Nature Reserve Maps
Can an interactive nature reserve map work when hikers lose cell service?
Yes. Modern web browsers support Service Workers and the Cache API. By packaging your interactive nature reserve map as a Progressive Web App (PWA), you can instruct the browser to save your HTML, JavaScript, CSS, and GeoJSON files onto the device storage. While downloading entire worldwide raster tilesets offline requires native mobile apps, an interactive nature reserve map with lightweight vector data and local map styles can remain functional even when cell reception drops in remote valleys.
How much does it cost to run Mapbox GL JS on a conservation site?
For almost all small to medium nature centers, land trusts, and public parks, running an interactive nature reserve map is completely free. Mapbox offers 50,000 free map loads every month. A typical regional reserve website rarely exceeds that threshold. If your site does experience massive seasonal spikes, costs are predictable and modest. Mapbox also maintains educational and nonprofit grant programs that help qualified conservation organizations offset usage costs.
What is the difference between GeoJSON and Shapefiles?
A Shapefile is an older spatial data format created by Esri in the 1990s. While Shapefiles remain common in government databases and desktop GIS tools, web browsers cannot read them natively. GeoJSON is a modern, lightweight standard based on plain text that any web browser understands right out of the box. When preparing data for an interactive nature reserve map, always export your work from GIS desktop software as GeoJSON or TopoJSON.
How do I add photography to trail popups?
You can include standard HTML <img> tags inside the string you pass to popup.setHTML(). To ensure fast loading on mobile networks, resize your images to small preview dimensions (such as 400 pixels wide) and use compressed web formats like WebP. Including a thumbnail photo of a scenic overlook or trail marker inside your interactive nature reserve map helps hikers confirm they are on the right path.
Final Thoughts and an Implementation Checklist
Building an interactive nature reserve map is one of the most rewarding ways to merge technology with environmental stewardship. By moving beyond static paper brochures and embracing vector-driven WebGL mapping, you create an educational tool that helps people connect with the outdoors safely and thoughtfully.
Here is your quick pre-launch deployment checklist:
- [ ] Clean all GIS files and confirm coordinates are in WGS 84 (EPSG:4326) with Longitude listed first.
- [ ] Simplify complex polygon vectors to keep file sizes low for mobile visitors.
- [ ] Restrict your public Mapbox access token to your specific website domains.
- [ ] Apply a biophilic color palette with strong contrast ratios for outdoor, bright-sunlight readability.
- [ ] Set modest 3D terrain elevation exaggeration (1.1x to 1.3x) so hills look natural rather than distorted.
- [ ] Use
setFeatureStatefor fast, GPU-accelerated hover highlights along trail paths. - [ ] Connect device geolocation so visitors can orient their position while walking outdoors.
- [ ] Add fallback semantic HTML tables and structured schema data so your interactive nature reserve map remains accessible to screen readers and search engines.
With these foundations in place, your interactive nature reserve map will stand as an inviting, reliable digital doorway to the natural landscape.