The modern website is no longer a static page; it has evolved into a dynamic environment. At the forefront of this transformation are Geographic Information Systems (GIS), the core technology turning these abstract digital spaces into tangible, relatable places. The simple act of embedding a map has given way to a new paradigm of interactive and data rich web applications. These applications are spatially aware, meaning they understand location not just as a point on a map, but as a context for delivering information and creating meaning.
This article analyzes the latest technological trends in GIS for web design. It examines the critical shift from basic embedded maps to fully interactive platforms. These platforms are powered by vector tiles, 3D rendering, real time data streams, artificial intelligence, and new forms of narrative driven mapping. By understanding these trends, developers and designers can build more engaging websites that can even foster a digital connection to the natural world.
Table of Contents
Foundational Knowledge: What is Web GIS?

To understand the current trends, one must first grasp the concept of Web GIS. At its core, Web GIS is a system for delivering geographic information and analysis over the internet. Unlike traditional desktop GIS software which runs on a single computer, a Web GIS operates on a network, most commonly the web. This structure makes geographic data accessible to a vast audience through a simple web browser, without needing special software.
This system has a few key parts that work together. Think of it as a team where each member has a specific job.
First is the Client-Side. This is what you see and interact with in your web browser, like Google Chrome, Firefox, or Safari. The client is responsible for showing the map and letting you interact with it, for example by panning, zooming, or clicking on features. This is all made possible by code written in JavaScript. Special JavaScript libraries are used to draw the map, handle user inputs, and request data from the server.
Next is the Server-Side. This is the powerhouse working behind the scenes. The server stores all the geographic data and does the heavy lifting. When you zoom into a map on a website, the client (your browser) sends a request to the server. The server then finds the correct data for that location and zoom level and sends it back to your browser to be displayed. This could be a web server that simply holds files or a specialized “map server” or “feature server” like GeoServer, which can perform complex queries and analysis on the data before sending it.
Finally, there is the Data itself. Geographic data comes in many shapes and sizes. The most common format used on the web today is called GeoJSON. It is a text based format that is lightweight and easy for JavaScript to understand. It describes geographic features like points, lines, and polygons, and can hold extra information about them, called attributes. For example, a point might represent a city, and its attributes could be the city’s name, population, and state. For the map imagery itself, the data is often delivered in small, square images called “tiles.” The evolution of these tiles is a major trend we will discuss later.
The journey of Web GIS has been remarkable. In the early days of the internet, adding a map to a website meant creating a static image file, like a GIF or JPEG. It was a picture of a map, with no interactivity. The revolution came with “slippy maps,” a term coined for the smooth, seamless experience introduced by the first Google Maps. Users could click and drag the map as if it were a single giant sheet of paper. This was achieved by loading a grid of small map image tiles in the background.
Today, we are moving beyond even that, into a world of high performance, fully data driven platforms where every element of the map can be customized and animated in real time.
The Modern Tech Stack: Key Platforms and Libraries

Choosing the right tool for the job is critical in web development, and Web GIS is no exception. The market is filled with a variety of platforms and libraries, each with unique strengths. These tools can be broadly categorized into two groups: proprietary platforms, which are often part of a larger ecosystem and come with support and advanced features, and open source libraries, which offer maximum flexibility and are driven by community collaboration.
Proprietary Platforms (High-Functionality, Enterprise-Ready)
These platforms are commercial products that typically charge for their services, often based on usage. They provide a polished, well documented, and powerful set of tools ideal for businesses and large scale projects.
- Esri ArcGIS API for JavaScript: Esri is a dominant force in the traditional GIS world, and its web API is a natural extension of its powerful ecosystem. Its greatest strength lies in its advanced spatial analysis capabilities. You can perform complex calculations and data processing directly within the web application. It also has best in class support for creating and displaying detailed 3D maps and scenes. For any organization already invested in Esri products like ArcGIS Pro or ArcGIS Online, this API is the logical choice, as it integrates seamlessly with their existing data and services.
- Google Maps Platform: This is perhaps the most recognized mapping platform in the world. Its primary advantage is its immense and highly accurate database of global Points of Interest (POI). If your website needs to show businesses, restaurants, or landmarks, or if it requires robust features like turn by turn directions (routing) or address finding (geocoding), the Google Maps Platform is an excellent choice. Its APIs are famously easy to use for basic map embedding, making it a popular starting point for many developers.
- Mapbox: Mapbox has carved out a niche by focusing on design and customization. Its flagship product, Mapbox Studio, is a web based interface that allows designers to create beautiful, bespoke map styles without writing any code. They pioneered the widespread use of vector tiles, which allows for this deep level of customization. Their rendering engine, Mapbox GL JS, uses the power of the computer’s graphics card to create incredibly smooth and fast maps that can handle large amounts of data. For projects where the map’s visual aesthetic is paramount, Mapbox is often the leading contender.
Open-Source Libraries (High-Flexibility, Community-Driven)
Open source means the code is free to use, modify, and share. These libraries are maintained by a global community of developers. They offer unparalleled control and flexibility, but may require more technical expertise to implement.
- Leaflet.js: Leaflet is famous for its simplicity and small file size. Its motto is “simplicity, performance and usability.” It is incredibly easy to learn and can be used to create a beautiful, functional interactive map with just a few lines of code. While it is lightweight, it is also very powerful due to its plugin architecture. There is a vast library of third party plugins that can add almost any feature imaginable, from heatmaps to custom markers and drawing tools. For projects that need a simple, fast, and reliable map, Leaflet is the go to standard.
- OpenLayers: If Leaflet is a simple, elegant tool, OpenLayers is a more comprehensive and powerful workshop. It is designed to handle more complex GIS tasks directly in the browser. It supports a wider range of map projections and data formats out of the box than Leaflet does. If your project requires connecting to specialized GIS servers or displaying data in a non standard coordinate system, OpenLayers provides the robust functionality needed to handle those challenges.
When deciding between them, the choice often comes down to the project’s specific needs. For a complex corporate dashboard with deep spatial analysis, the ArcGIS API might be best. For a store locator on a retail website, Google Maps is a strong option. For a visually unique brand experience, Mapbox excels. For a community project or a simple, fast map on a blog, Leaflet is perfect. The key is to match the tool’s strengths to the goals of the website.
Dominant Trends Shaping GIS in Web Design for 2025 and Beyond
The field of Web GIS is not standing still. New technologies and approaches are constantly emerging, pushing the boundaries of what is possible in a web browser. Here are five of the most significant trends that are defining the future of mapping on the web.
Trend 1: The Ubiquity of Vector Tiles
For many years, web maps were built from raster tiles. These are small, square images, like tiny JPEGs or PNGs, stitched together to form a map. When you zoomed in, the browser would simply load a new set of more detailed images for that area. This worked, but it was inefficient and inflexible. The style of the map, like the color of roads or the font of labels, was baked into the image files. Changing the style meant regenerating millions of images.
Vector tiles are a fundamentally different and better approach. Instead of sending pre rendered images, the server sends the raw geographic data (the vectors for points, lines, and polygons) in a highly compressed format. This data is then rendered into a visible map by the user’s browser in real time. This change has enormous benefits.
First, the data is much smaller, leading to faster map loading times. Second, because the map is drawn on the client side, it can be styled dynamically. With a few lines of code, a developer can change the color of every building on the map, make roads thicker at higher zoom levels, or even hide certain features based on user interaction. This allows for an incredible level of personalization and interactivity. You could have a map that changes from a light daytime theme to a dark nighttime theme automatically, or highlights different features depending on what a user is searching for.
This technology, pioneered by Mapbox with their Mapbox Vector Tile (MVT) specification, has become the industry standard and is the foundation for most modern, interactive web maps.
Trend 2: High-Performance 3D Rendering with WebGL
The world is not flat, and maps on the web no longer have to be. For a long time, creating 3D experiences on the web was difficult and required special browser plugins. That changed with the introduction of WebGL (Web Graphics Library), a standard web technology that gives developers access to a computer’s graphics processing unit (GPU). The GPU is designed for handling complex visual calculations, making it perfect for rendering 3D scenes.
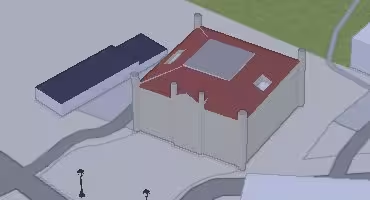
In the context of Web GIS, WebGL allows for the creation of stunning and informative 3D maps directly in the browser. Instead of a flat map, users can see a realistic 3D model of a city, complete with textured buildings and accurate terrain. They can tilt and rotate the view, flying through a city like a bird.
This is not just for visual appeal; it has practical applications. Architects and urban planners can use it to visualize proposed developments in the context of the existing city. Emergency responders can use 3D maps to better understand the terrain during a wildfire or flood. Scientists can model and visualize environmental data, like the plume of a pollutant in the air or the depth of an aquifer underground. Key technologies like CesiumJS, which is specifically designed for creating 3D globes and maps, along with the 3D capabilities of the ArcGIS API and Mapbox GL JS, are making these immersive experiences more common and accessible than ever before.
Trend 3: Real-Time Data Integration and Visualization
Historically, maps displayed static information, a snapshot of the world at a single point in time. The modern web, however, is dynamic and constantly updating. The latest trend in Web GIS is to create living maps that reflect the world as it is right now by integrating real time data feeds.
This is accomplished by connecting the web map to a live stream of data using technologies like APIs, WebSockets, or MQTT. Instead of loading data just once, the map continuously receives small updates and redraws itself to reflect the new information.
The applications for this are endless. Public transportation websites can show the exact location of buses and trains moving along their routes in real time. Weather maps can show storms developing and moving, animated second by second. Logistics companies can track their entire fleet of delivery vehicles on a single dashboard. Smart city initiatives can visualize data from thousands of Internet of Things (IoT) sensors, showing real time traffic congestion, air quality levels, or parking space availability. This transforms the map from a historical document into a live, operational tool for monitoring and decision making. It creates a far more engaging user experience, as people can see the world in motion directly on their screen.
Trend 4: AI and Machine Learning for Predictive Analysis
Artificial intelligence (AI) and machine learning (ML) are technologies that allow computers to learn from data and make predictions. Their integration with GIS is opening up a new frontier of spatial analysis on the web. Instead of just showing what is, maps can now begin to show what might be.
Vast amounts of geospatial data, from satellite imagery to user location data, can be fed into machine learning models. These models can then identify patterns that would be invisible to a human analyst. For example, an AI could analyze years of traffic data to create a predictive heatmap, showing which intersections are most likely to be congested at a specific time of day in the future.
Another powerful application is automated feature extraction. A machine learning model can be trained to automatically identify objects in satellite or drone imagery. It could scan an image of a state and automatically digitize every swimming pool, or identify all the buildings that have had solar panels installed on their roofs. This process, which used to take teams of people months to complete, can now be done in hours. This predictive and automated analysis can then be delivered through a web map, giving users powerful new insights and a glimpse into the future.
Trend 5: Narrative Mapping and “Scrollytelling”
A map can be more than just a tool for finding directions; it can be a powerful medium for telling a story. “Scrollytelling” is a web design technique that combines text with interactive multimedia elements that change as the user scrolls down the page. When combined with a web map, it creates an immersive and engaging narrative experience.
Here is how it works: as a user reads an article and scrolls down, the map view on the side of the screen automatically pans, zooms, and updates to highlight the specific location or data being discussed in the text. For example, an article about a historical battle could fly the user from one key location to the next as they read about the events that unfolded there. A piece of data journalism about climate change could show how coastlines are projected to change as the user scrolls through the timeline of rising sea levels.
This technique is incredibly effective because it guides the user through a complex spatial story in a clear and intuitive way. It removes the need for the user to manually pan and zoom to find what the text is talking about. It creates a seamless and cinematic experience that is much more engaging than a static map and a separate block of text. News organizations like The New York Times and data visualization sites like The Pudding have used this technique to create award winning stories that bring data to life.
Application in Practice: Case Studies and Biophilic Integration
These trends are not just theoretical concepts; they are being used today to build powerful and useful websites.
In the world of real estate, Zillow provides a prime example. Their website’s maps go far beyond showing a property’s location. They integrate vast datasets, allowing users to overlay information like school district boundaries, property tax records, and even 3D views of the neighborhood. This use of multiple data layers on an interactive map gives potential buyers a deep understanding of a property’s context.
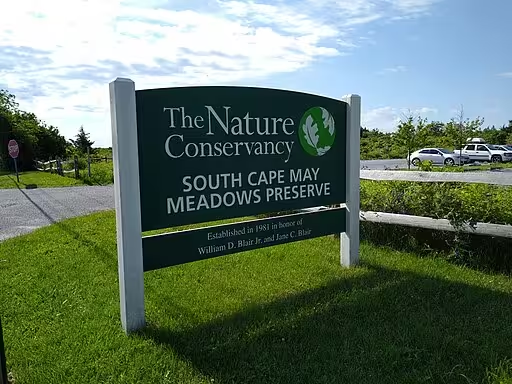
In environmental science, organizations like The Nature Conservancy use narrative mapping to tell compelling stories about their conservation work. Their websites feature interactive maps that allow donors and supporters to explore specific project sites, understand the ecological importance of different regions, and see the impact of their contributions. This transforms abstract data about conservation into a tangible and personal story.
Beyond these conventional uses, these GIS trends offer a unique opportunity to apply the principles of biophilic design to the digital realm. Biophilic design is the practice of connecting people with nature in the built environment. We can extend this concept to the digital environments we create. One of the core patterns of biophilic design is creating a “Sense of Place,” which means strengthening the connection to a specific local environment.
Imagine a company based in Boston. Their corporate website could go beyond generic stock photos. Using Web GIS, they could feature a beautifully designed, interactive map on their homepage. This map could visualize real time data of the Charles River’s water quality, fed from public IoT sensors. Or it could display a detailed map of the tree canopy coverage in local neighborhoods, highlighting the city’s green spaces.
By integrating dynamic, localized, and nature focused data, the website connects the digital brand to its physical, living environment. It creates a unique sense of place, giving employees and customers a subtle but powerful connection to the local ecosystem, even through a screen. This is the future of authentic digital design: creating experiences that are not only technologically advanced but also human centered and grounded in the real world.
Conclusion: The Future is Spatially Aware
The evolution of GIS in web design is a story of increasing dynamism, interactivity, and intelligence. The major trends are all interconnected. Vector tiles provide the fast, customizable foundation. WebGL builds upon this with immersive 3D rendering. Real time data feeds breathe life into these visual platforms, and artificial intelligence provides a layer of predictive insight. Finally, scrollytelling techniques weave these elements together to create compelling spatial narratives.
The future of web design lies in creating experiences that are not just visually appealing but also contextually and spatially aware. As these powerful GIS technologies become more accessible to developers and designers, we will see a new generation of websites. These sites will do more than just present information; they will inform, engage, and connect us to our world, and to nature itself, in ways we are only just beginning to imagine. The map is no longer just a part of the website; in many cases, the map is becoming the website itself.